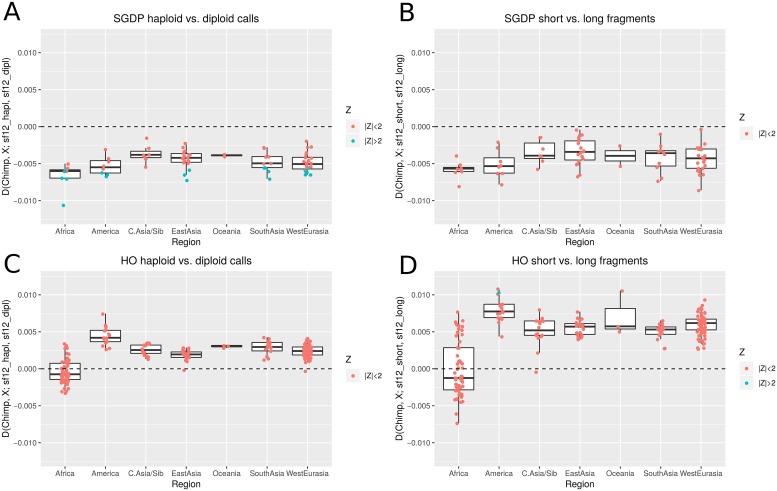
Fig 3. D statistics testing the affinity between different modern populations (X) and two different treatments of the high coverage individual sf12.
The basis for these comparisons are the whole genome sequence data of the SGDP panel (A and B) or SNP array genotype data from the HO panel (C and D). Comparisons are done between pseudo-haploid and diploid calls for sf12 (A and C), and between pseudo-haploid calls from short (35-40 bp) or long (75-80 bp) fragments (B and D). The x axis represents the geographic origin of population X.

