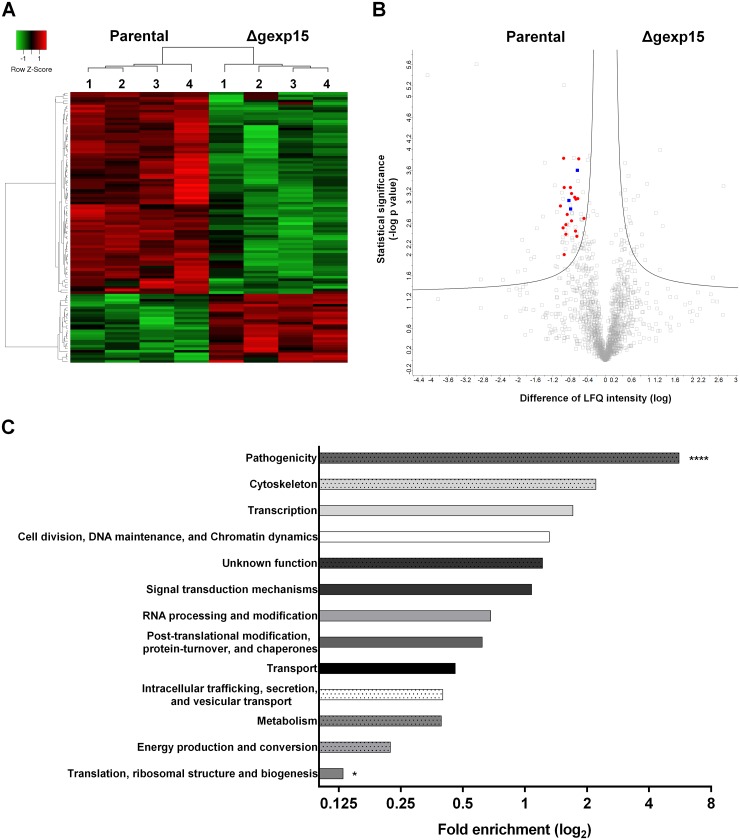
Fig 5. Differential proteome of parental and Δgexp15 schizonts in P. berghei.
(A) Hierarchical clustering and heatmap of proteins with a significant differential abundance in parental and Δgexp15 schizonts (FDR<0.05, S0 = 0.1). (B) Volcano plot representation of proteins quantified by mass spectrometry in parental and Δgexp15 schizonts (FDR<0.05, S0 = 0.1). AP2 transcription factors are indicated as blue squares and proteins involved in the pathogenicity as red dots. (C) Functional enrichment of parental and Δgexp15 schizonts proteomic profiles. Fold enrichment was performed on the 106 filtered proteins relative to all P. berghei proteins detected in the proteome. The x-axis represents the fold enrichment (log2) for the indicated function (Hypergeometric test, ** p<0.01, **** p<0.0001).

