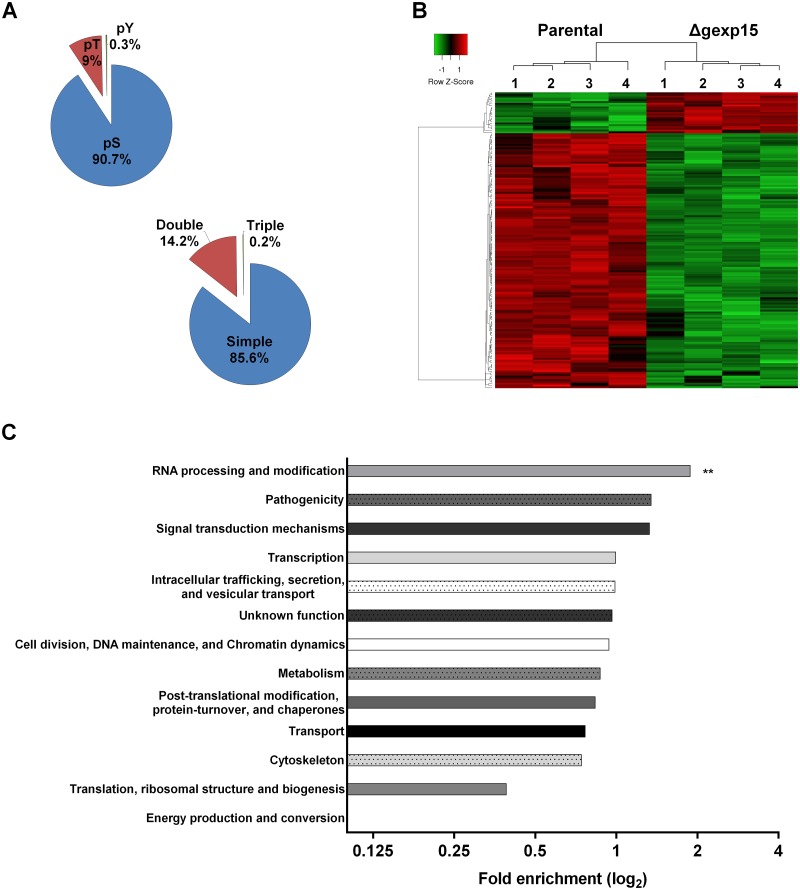
Fig 6. Differential phosphoproteome of parental and Δgexp15 schizonts in P. berghei.
(A) Distribution of phospho-Ser (pS), phospho-Thr (pT), and phospho-Tyr (pY) residues and multiplicity of phosphosites detected in schizonts (n = 2460). (B) Hierarchical clustering and heatmap of phosphosites with a significant differential in parental and Δgexp15 schizonts (FDR<0.01, S0 = 0.1). (C) Functional enrichment of parental and Δgexp15 schizont phosphoproteomic profiles. Fold enrichment was performed on the 166 filtered phosphosites relative to all P. berghei phosphosites detected in the phosphoproteome. The x-axis represents the fold enrichment (log2) for the indicated function (Hypergeometric test, ** p<0.01).

