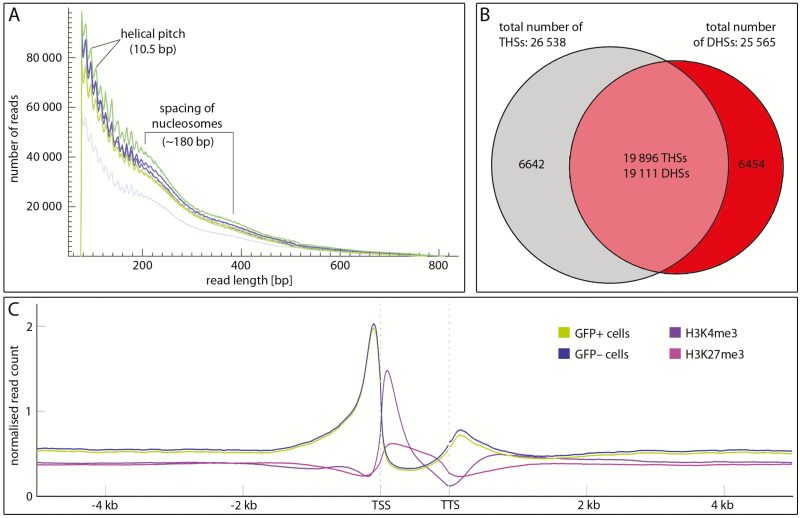
Fig. 1.
Quality controls and distribution of ATAC-seq reads. (A) Absolute read numbers in a 50–820-bp size window in three biological replicates of GFP+ (green) and GFP– (blue) cells. The jagged line most prominent below 200 bp read length shows peaking read numbers at a spacing of 10.5 bp, which relates to the helical pitch, and the smooth curve between 200 and 400 indicates 180-bp spacing of nucleosomes. (B) Venn diagram comparing THSs (grey) with DHSs (red) in the ap1 cal IM; note that the majority of DHSs and THSs overlap (pale red). Similar fractions are unique to ATAC-seq or DNase-seq. (C) Mean ATAC-seq signal [green (GFP+) or blue (GFP–)] of all annotated Arabidopsis genes in 5 kb up- or downstream flanking sequences relative to the transcription unit compared with the distribution of H3K4me3 activation (purple) or H3K27me3 (pink) repression marks. Note the pronounced preference of THSs at the transcription start site (TSS) and at a lower frequency at the transcription termination site (TTS).

