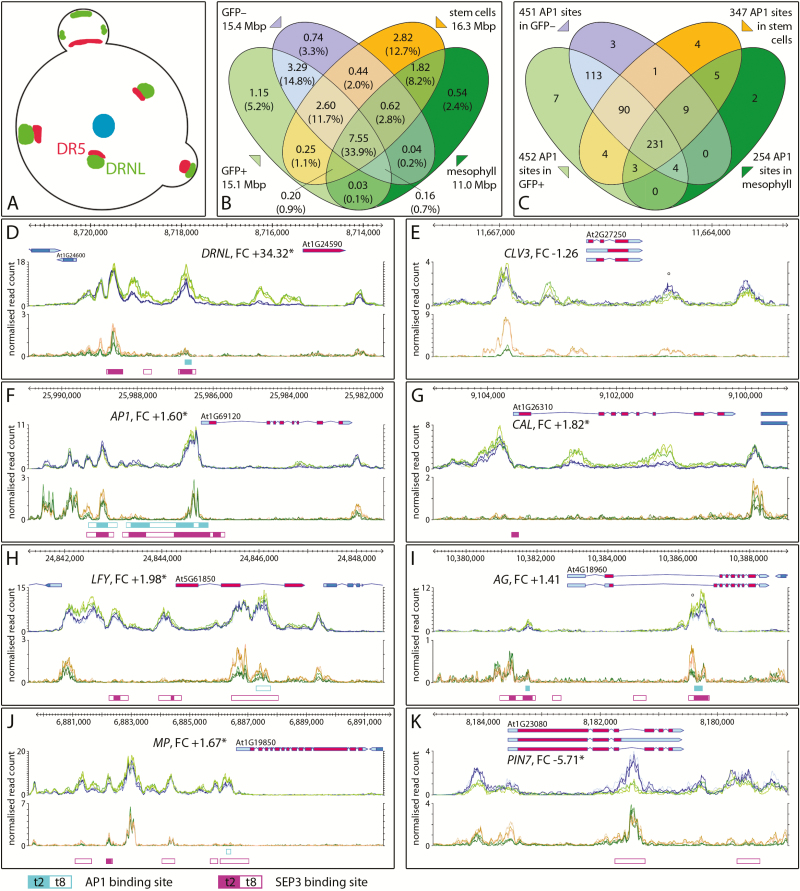
Fig. 5.
Open chromatin regions in the ap1 cal inflorescence meristem relative to stem and mesophyll cells and MADS domain transcription factor binding. (A) Cartoon of the inflorescence meristem depicting the stem cell population (blue), DRNL-expressing cells (green), and auxin response maxima (red) (Chandler and Werr, 2014). (B) Venn diagram of open chromatin regions in GFP+ and GFP– cells in comparison with stem and mesophyll cells (Sijacic et al., 2018). (C) Distribution of AP1 binding sites in THSs of LOFCs or GFP– cells relative to AP1 binding sites in THSs of vegetative stem and leaf mesophyll cells. (D–K) Chromatin configuration of eight exemplary gene loci: graphs represent normalized ATAC-seq read counts of GFP+ (bright green) and GFP– (blue) cells of the ap1 cal IM (upper panel) or stem (orange) and mesophyll (dark green) cells (lower panel). (D) DRNL, (E) CLV3, (F) AP1, (G) CAL, (H) LFY, (I) AG, (J) MP, and (K) PIN7. The positions of AP1 and SEP3 binding sites (Pajoro et al., 2014) are depicted below the graphs according to the colour code below the figure with filled boxes representing stage 2 (t2) or open boxes stage 8 (t8). The position of WUS binding sites in the 3′-THS of CLV3 (E) and the intronic THS of AG (I) are marked by an open circle (°); all other gene descriptions are as in the legend of Fig. 3.

