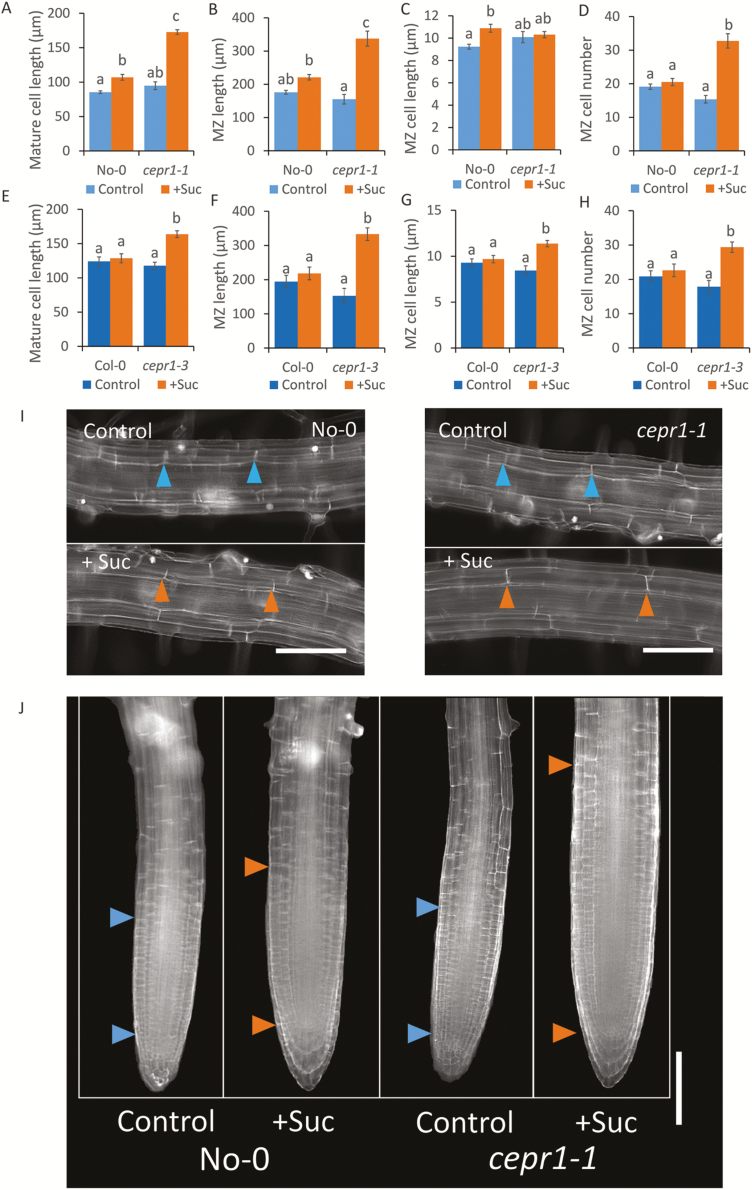
Fig. 3.
CEPR1 represses LR mature cell length and MZ size in response to applied sucrose. The effect of sucrose on LR mature cell length and MZ size for WT and cepr1 in the No-0 (A–D) and Col-0 (E–H) backgrounds was measured after 10 d growth on medium with or without sucrose. (A–E) Length of mature cortical cells in emerged LRs (n≥54 cells). (B–F) MZ total length; (C, G) MZ cell length; and (D, H) MZ cell number in emerged LRs (n≥7 roots). Different letters indicate statistically significant differences (P≤0.05, two-way ANOVA followed by Bonferroni multiple comparisons test). Bars indicate the SE. Representative images of mature cortical cells (I) and MZ (J) of LRs in No-0 and cepr1-1. Arrows indicate mature cell length and MZ size, respectively. Bars indicate the SE. Scale bars=100 µm.

