Fig. 5.
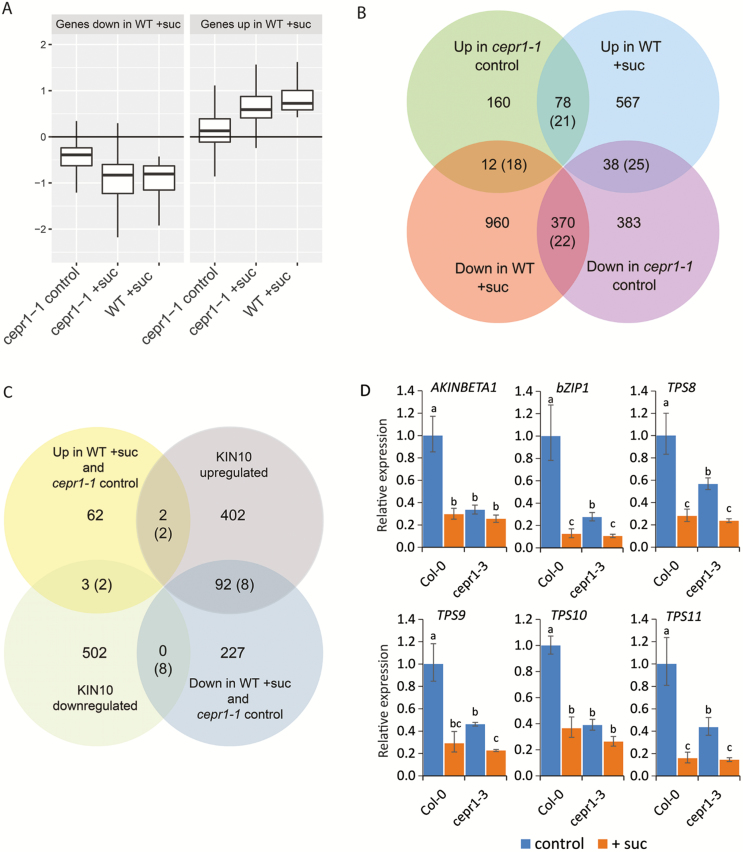
Transcriptional responses to sucrose intersect with CEP–CEPR1 signalling. The transcriptional response of WT and cepr1-1 roots was assessed by RNA-Seq 4 h after transfer to medium without (control) or with 1% sucrose (+suc). (A) Mean expression in each treatment group for genes significantly up- and down-regulated by sucrose in the WT, relative to levels in WT control. Outlier points are not shown. (B) Intersection of genes significantly up- and down-regulated in WT+suc and cepr1-1 control compared with WT control. (C) Genes significantly down- or up-regulated in the same direction in WT+suc and in cepr1-1 control (Supplementary Tables S5 and S6, respectively) compared with the global list of KIN10 up- or down-regulated genes from Baena-González et al. (2007) as determined by microarray analysis. The evaluation of overlapping genes was restricted to genes present on the microarray, as described in the Materials and methods. Values in parentheses indicate the expected number of overlapping genes if the two gene sets were independent. For a summary of 95% confidence intervals for the overlaps, see Tables S4 and S8, respectively. (D) Expression of a shortlist of overlapping KIN10 target genes in the Col-0 and cepr1-3 backgrounds in response to sucrose. Seedlings were treated as described for the RNA-Seq experiment and whole roots were harvested for gene expression analysis using qRT–PCR. Letters indicate significant differences (two-way ANOVA followed by Fisher’s least significant difference test, α=0.05). Bars indicate the SE, n=3.

