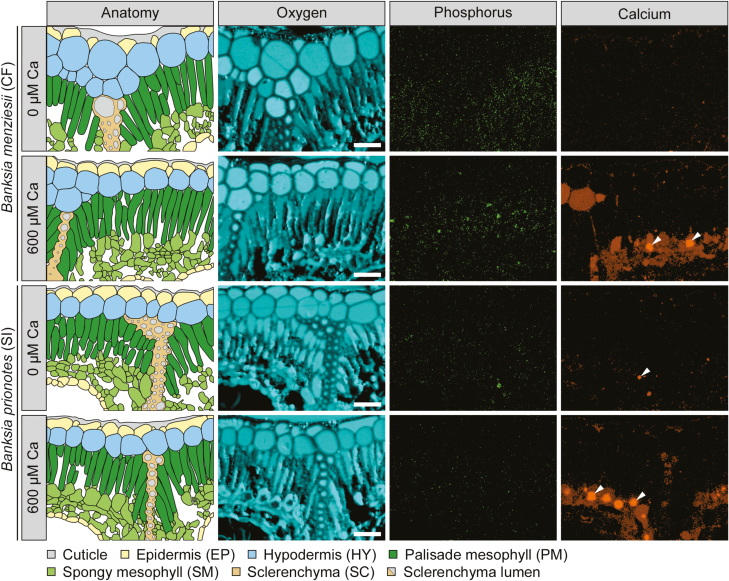
Fig. 4.
Qualitative element maps and corresponding anatomical schematics, showing phosphorus (P), calcium (Ca), and oxygen (O) distributions in transverse leaf sections of two Banksia species, grown under two Ca treatments (0 µM and 600 µM) and high P supply (10 µM). Comparison of a typical calcifuge (CF) and soil-indifferent (SI) Banksia species. All leaves were dorsiventral with stomatal crypts on the abaxial surface. Images capture the upper part of transverse sections, with the adaxial surface at the top. P and Ca maps are corrected for peak overlaps and background subtraction, and provide a visualization of the distribution, with quantified concentrations in Figs 1 and 3 (Supplementary Table S3). Only plants grown under high P (10 µM)/high Ca (600 µM) showed symptoms of P toxicity. Arrowheads indicate Ca-based crystals. Scale bar=50 µm.

