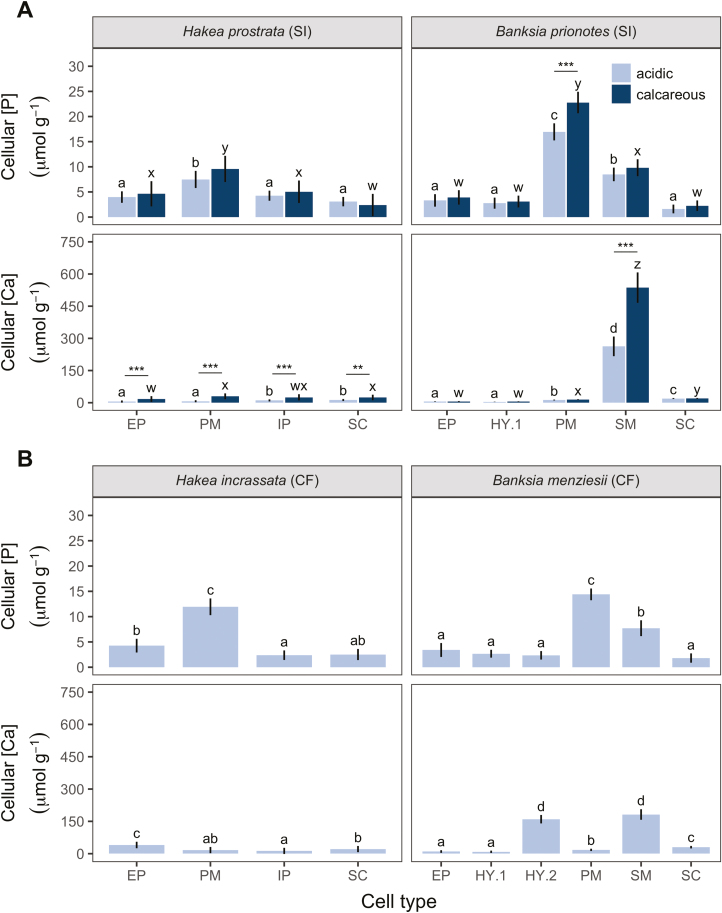
Fig. 6.
Leaf cell-specific phosphorus ([P]) and calcium ([Ca]) concentrations in natural populations of Proteaceae collected from field locations of contrasting soil type along the Jurien Bay chronosequence, south-western Australia. Comparison of typical (A) soil-indifferent (SI), and (B) calcifuge (CF) Hakea and Banksia species, indicating soil type(s) on which they were collected. (A) SI species are found on both acidic and calcareous soils; (B) CF species are only found on acidic soils. Calcareous soils are higher in total and available soil [P], and exchangeable [Ca], compared with acidic soils (Supplementary Table S2). None of the field-collected plants showed signs of P toxicity. Concentrations are per unit fresh weight, from fully hydrated cells. Bars are means, and error bars represent 95% confidence intervals, from linear mixed-effect models. Different letters indicate significant differences among cell types within each soil type and panel (post-hoc Tukey test, P<0.05). (A) P-values (*, <0.05; **, <0.01; ***, <0.001) represent significant differences between soil types (post-hoc Tukey test) in SI species. EP, epidermis; HY.1, upper layer of hypodermis; HY.2, lower layer of hypodermis; PM, palisade mesophyll; SM, spongy mesophyll; IP, internal parenchyma; SC, sclerenchyma. Data for plants collected on acidic soils are from Hayes et al. (2018).

