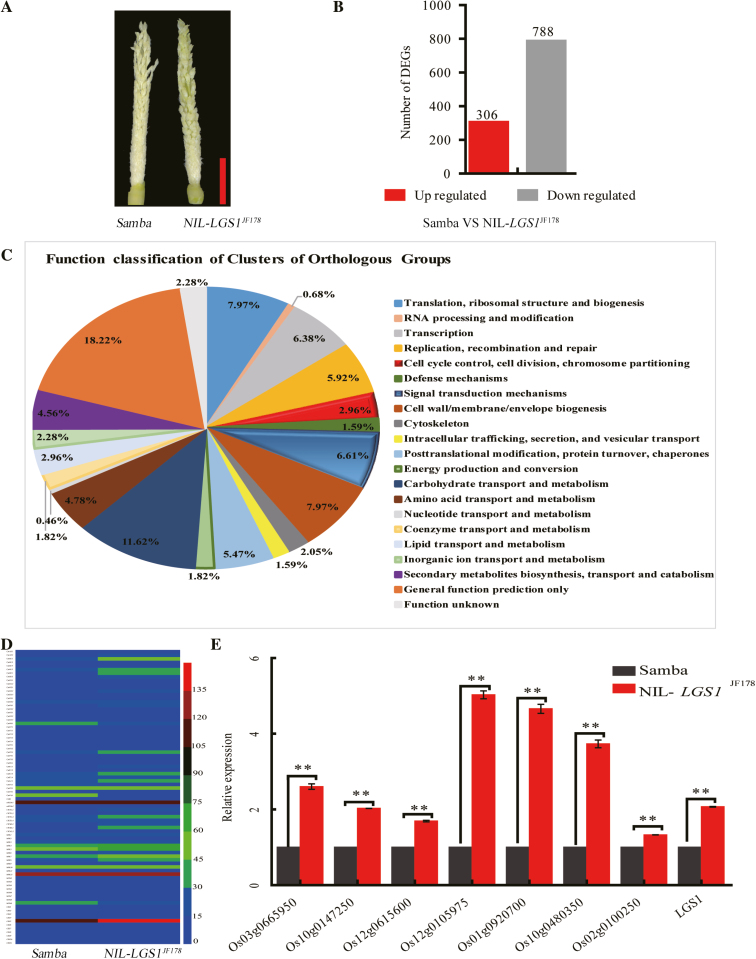
Fig. 6.
RNA-seq analysis of LGS1-NILs. (A) Phenotype of young panicles. Scale bar=1 cm. (B) Number of differentially expressed genes (DEGs, >2-fold change) of NIL-LGS1JF178 as compared with Samba. (C) DEG analysis of COG annotation. (D) Heat map of cell cycle-related DEGs (n=3). The scale bar, horizontal bars, and numbers indicate the FPKM (fragments per kilobase million) values. (E) Expression of the uncharacterized cell cycle-related genes by qRT-PCR (n=3). Samba as a control. Values are given as the mean ±SE. **P<0.01 was calculated by Student’s t-test.

