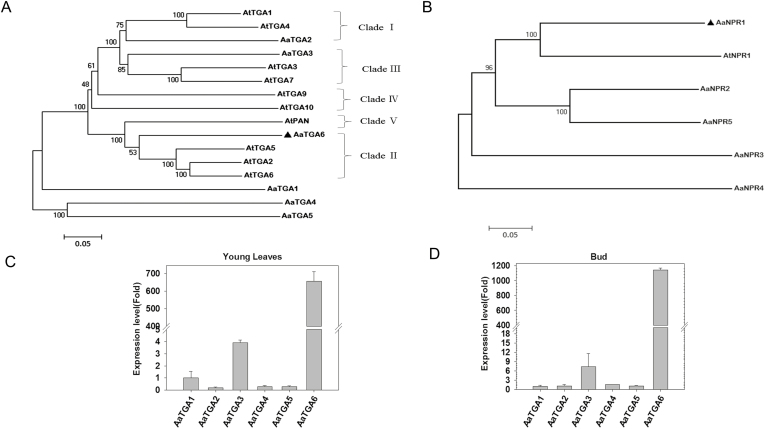
Fig. 1.
Characterizations of NPRs and TGAs in Artemisia annua. Phylogenetic trees of (A) TGAs and (B) NPRs in A. annua (Aa) and Arabidopsis (At). The trees were constructed using MEGA 5 with the neighbor-joining method (1000 bootstrap replicates). The scale bars indicate the evolutionary distance of the sequences examined. AaTGA6 and AaNPR1 are indicated with black triangles. Expression of TGAs in (C) young leaves and (D) buds. Expression values are relative to those of TGA1. Data are means (±SE) of n=3 biologically independent samples.

