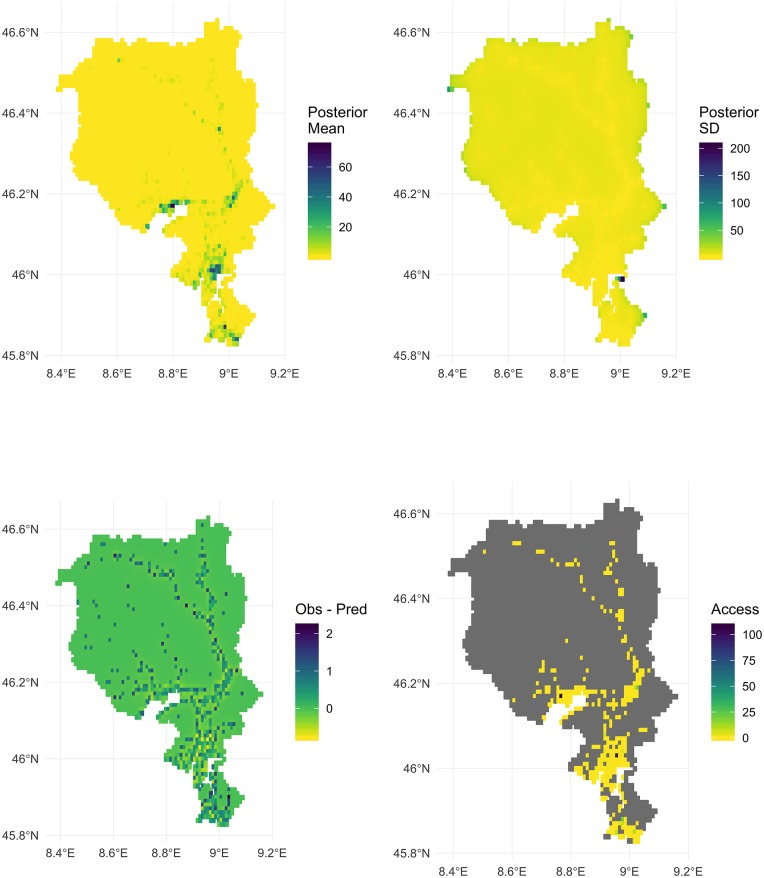
Fig 5.
Top Left: Posterior mean estimates of the number of OHCA events in each spatial area, Top Right: Posterior Estimates of Standard Deviation of the number of OHCA events in each spatial area, Bottom Left: Error as measured by the observed—posterior mean of the number of OHCA events in each spatial area. Bottom Right: Access score areas with predicted OHCA count of less than 1 are ignored (grey).

