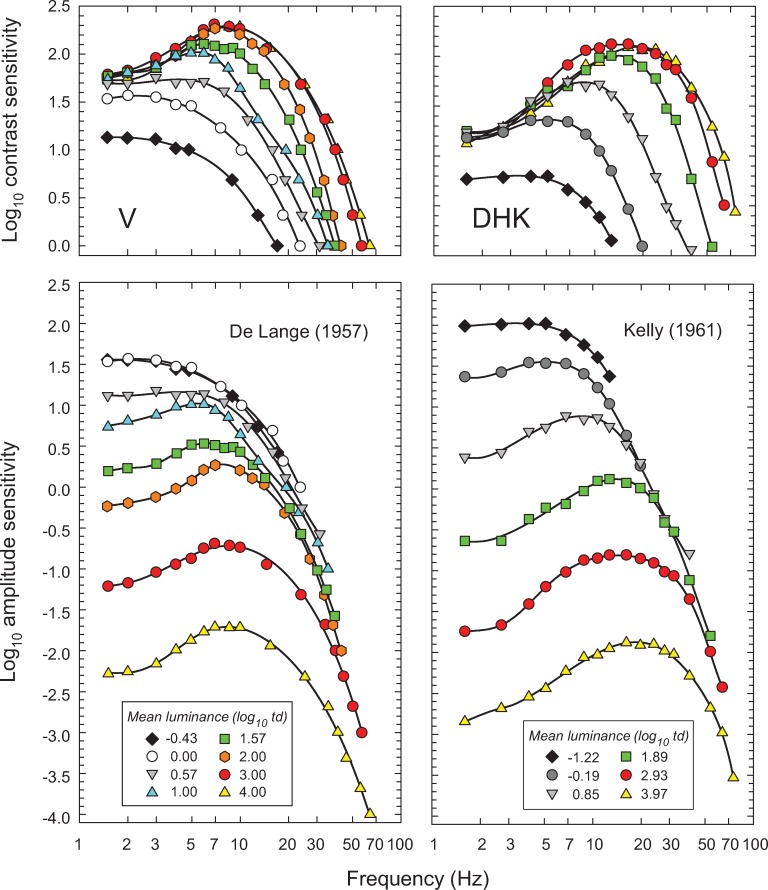
Fig 1. The left-hand column shows data for observer V from De Lange [14] and the right-hand column, data for observer DHK from Kelly [15] both measured using sinusoidally flickering stimuli.
The data are shown twice: The upper panels show the logarithm of the reciprocal of the just-detectable contrast (the contrast sensitivity) as a function of frequency (Hz) plotted on a logarithmic scale. The lower panels show the same data replotted as the logarithm of the reciprocal of the just-detectable amplitude (the amplitude sensitivity) also as a function of frequency (logarithmic scale). Different symbols and colors denote different mean retinal illuminances (log10 photopic trolands) as indicated in the key. The black curves are arbitrary smooth functions fitted to each dataset to facilitate comparison. Data are from Figure 5 in De Lange [14], who used a 2° diameter, centrally fixated, white flickering test field in a steady 60° diameter surround of same luminance and chromaticity, and from data tabulated in Table 1 in Kelly [15], who used a centrally-fixated, 50° diameter white target vignetted gradually from 50 to 68°.

