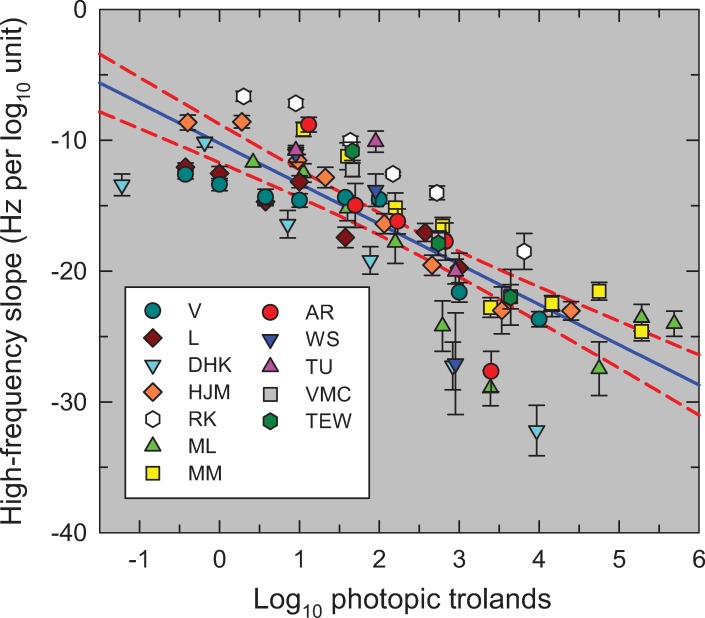
Fig 7. The reciprocal of the slopes of the red lines in Figs 2–6 (Hz per log10 unit sensitivity) plotted as a function of the mean intensity in log10 photopic trolands.
The lines were fitted to the higher frequency amplitude-sensitivity data for each observer for each mean light level. The error bars are ±1 standard error of the fitted slope (see Table A). The solid blue line is the linear regression (Pearson correlation coefficient = 0.801, p<0.0001) and the dashed red lines are the 95% confidence intervals.

