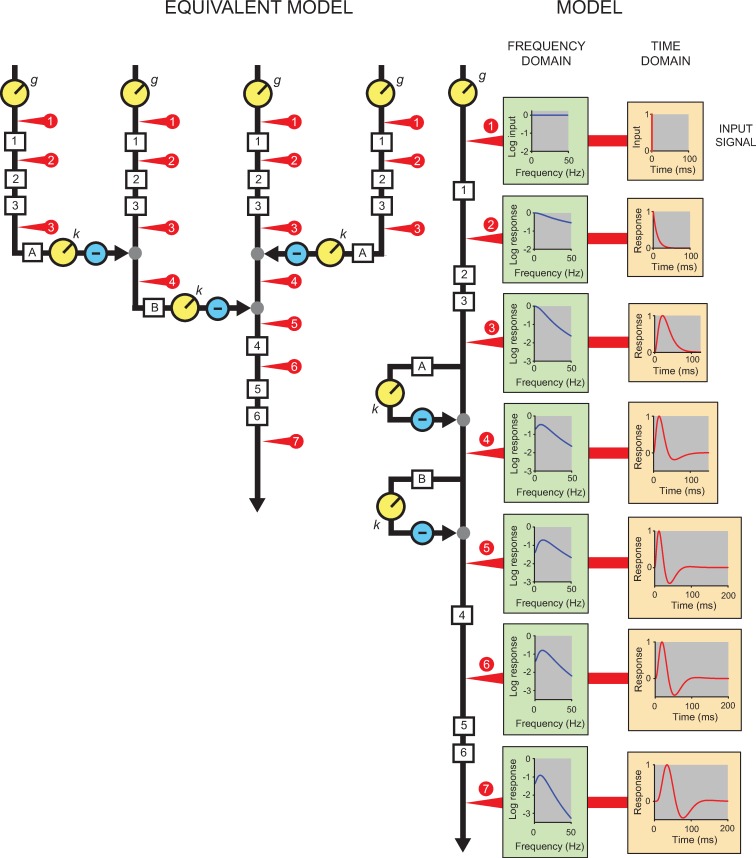
Fig 8. The direct cascade used to model flicker sensitivity is shown along the vertical black line labelled MODEL and has six low-pass stages (1–6) and two inhibitory stages (A and B).
The six variable speed LP-filters (1–4, and A, B) have the same corner frequency of 15 Hz in this example and the two fixed-speed LP-filters (5, 6) have a corner frequency of 30 Hz (see text). The effects on an impulsive input signal (top orange panel) at different stages of the model (denoted by the numbered red arrows) are shown as a function of time in the orange panels of right-hand column and, in the corresponding green panels, as the logarithm of amplitude of the response as a function of frequency. The amplitude spectrum of the input is flat with equal amplitude at all frequencies (top green panel). An early gain adjustment, g, controls the overall gain of the system. The second orange and green panels show the effects of the first LP-stage and the third orange and green panels, the effects of a cascade of three stages. Next, the fourth and fifth pair of panels show the additional effects of one and two feedforward stages, respectively. The two feedforward stages include a common scaler, k, after which the feedforward signal is subtracted from its input. They produce a triphasic temporal response (orange panels) and a bandpass frequency response (green panels). The sixth pair of panels show the effects of another LP-stage with a corner frequency of 15 Hz and the final pair the effects of two final stages with corner frequencies of 30 Hz. The Equivalent Model on the left is mathematically equivalent to the cascade but has lateral connections that are more consistent with other psychophysical and physiological data.

