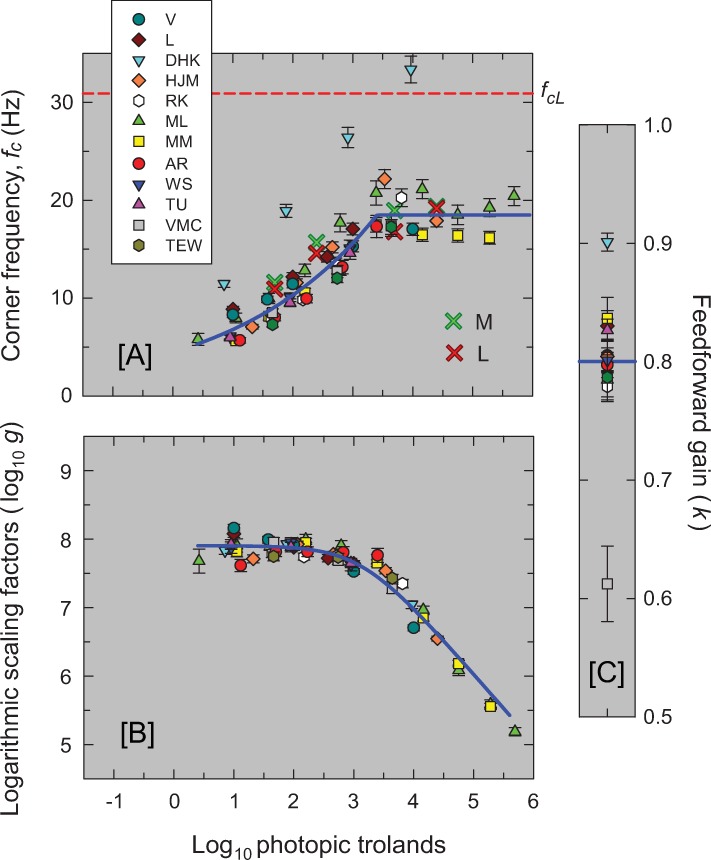
Fig 9. The three panels show the model’s best fitting parameter values for each of the twelve observers.
The error bars are ±1 standard error of the fitted parameter. Panel [A] shows the best-fitting corner frequencies (fc) in Hz common to the six variable-speed LP-filters as a function of mean level (log10 photopic trolands). [Corner frequency (Hz) is inversely proportional to the time constant τ: fc is equal to 1/(2πτ) where τ is in seconds.] The solid blue line through the data is the descriptive standard or mean function defined by Eq (3). The dashed horizontal red line marks the constant corner frequency of the final two fixed-speed stages (30.9 Hz). The red and green crosses are the corner frequencies of a 3-stage LP filter fitted to primate L- and M-cone responses, respectively, measured by Baudin et al. [37] and shown in Fig 10. Panel [B] shows the logarithmic of the best-fitting overall gain, log10g, but with the data for each observer vertically shifted to align with the descriptive standard function shown by the solid blue line and defined by Eq (4). Panel [C] shows the best-fitting scaling factor, k, common to the two inhibitory feedforward stages and fixed across mean luminance levels. The horizontal solid blue line shows the mean value of k (0.80). Only the parameters for levels thought to be cone-mediated are shown.

