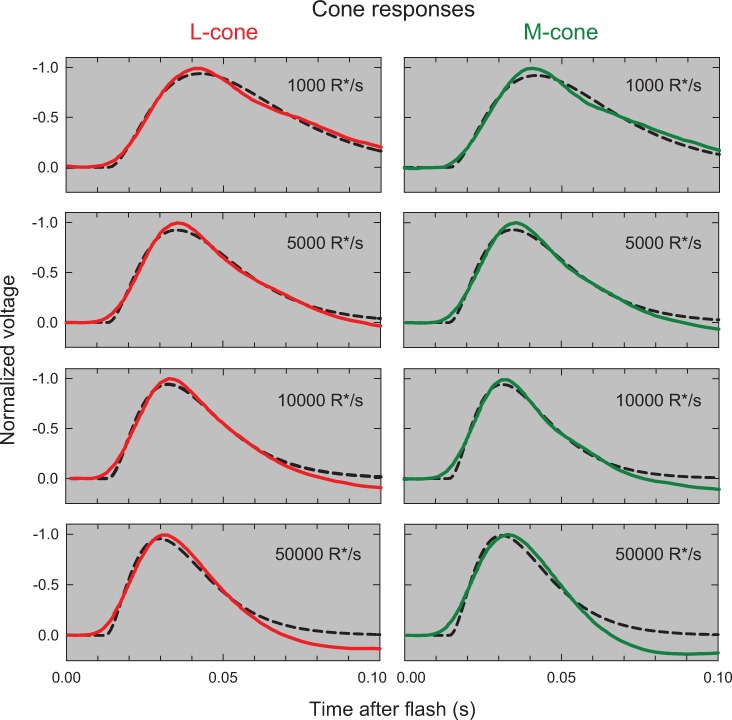
Fig 10. The panels in the left and right columns column show, respectively, the mean primate L-cone (red continuous lines) and M-cone (green continuous lines) responses measured by Baudin et al. [37] at mean levels of 1000, 5000, 10000 and 50000 photons absorbed per second (R*/s).
The dashed black lines show the best-fitting 3-stage LP filter responses with common corner frequencies, which vary with light level. For further details see text.

