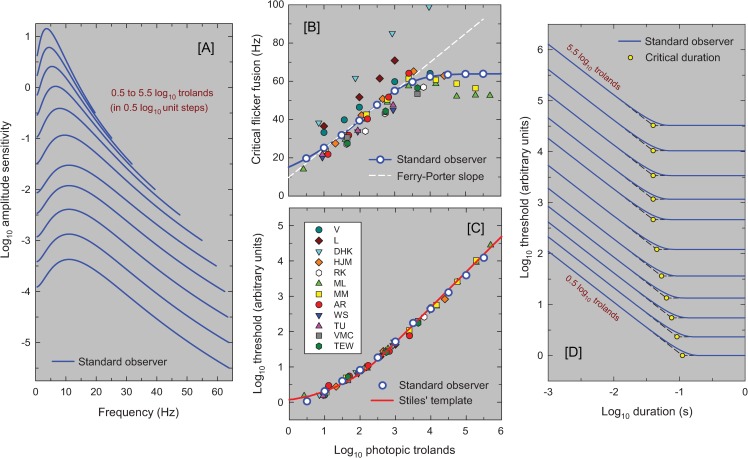
Fig 11. The panels show the standard model predictions.
Panel [A] shows the predicted TCSFs as amplitude sensitivities at a range of light levels (0.5 to 5.5 log10 trolands in 0.5 log10 steps). The TCSFs end at the assumed CFF for each level. Panel [B] shows the predicted CFFs extrapolated from the individual TCSF fits (as coloured symbols) and the predictions of the standard model shown as the continuous blue line, the white circles are in 0.5 log10 unit intervals and correspond to the line endings in Panel [A]. The dashed white line is the best fitting Ferry-Porter slope to the standard model. Panel [C] shows predicted threshold-versus-intensity (TVI) curves for brief flashes. The red line is Stiles’ template for TVI curves. The colored symbols for individual observers have been vertically shifted to align with Stiles’ template removing individual differences in overall gain. Panel [D] shows the predicted flash thresholds as a function of flash duration (both on log scale) for a range of light levels from 0.5 to 5.5 log10 trolands in 0.5 log10 steps. We have added dashed straight lines to indicate complete temporal summation at short durations (with slopes of -1) and the long duration asymptote (with slopes of 0). The duration at which these lines intersect is the “critical duration” indicated by the yellow circles.

