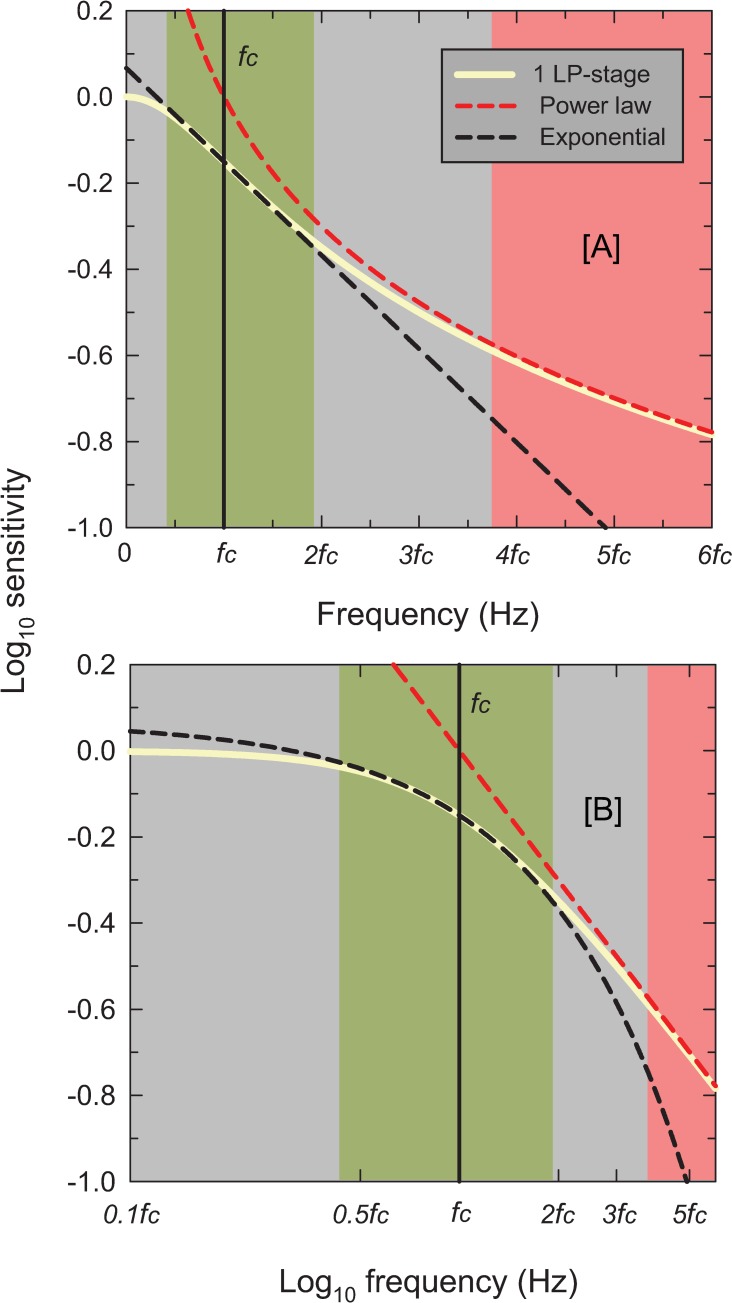
Fig 12. The solid cream-colored lines show the logarithmic relative amplitude response of one LP-stage plotted as a function of frequency on a linear scale in Panel [A] and on a logarithmic scale in Panel [B].
The maximum response has been normalized to 1. The corner frequency, fc, is indicated by the vertical black lines, and frequency is marked off in multiples of fc. The red dashed lines show the asymptotic frequency response, which in panel [B] is a straight line with a slope of -1 consistent with there being just one stage. The red region highlights the range above 3.74 fc where the filter response is within 0.015 log10 unit of the asymptotic response. The black-dashed lines, indicating exponential loss of sensitivity with increasing frequency and which describe the measurements shown in Figs 2–6, are the best exponential fit to the single LP-filter (cream lines) between 0.33fc and 2.0fc. The green region highlights the range from 0.43 to 1.92 fc within which the filter is within ±0.015 log10 unit of the exponential response (which is a straight line in Panel [A]).

