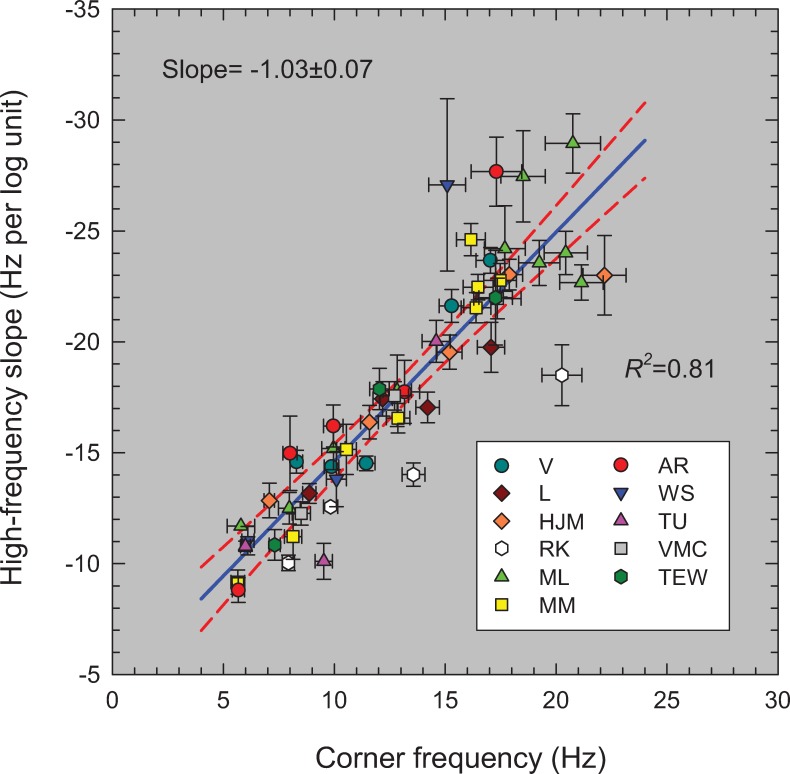
Fig 13. Best-fitting slopes (Hz per log10 unit sensitivity) for the linear high-frequency sensitivity losses from table A as a function of the corresponding best-fitting corner frequencies (Hz) from table B for the amplitude-sensitivity data shown in Figs 2–6.
(Note that the slope is plotted to become more negative upwards.) The solid blue line is the linear regression line, which has a slope of -1.03±0.07, an intercept of -4.28±0.97 Hz per log10 unit, and an adjusted R2 of 0.81. The dashed red lines are the 95% confidence intervals for the regression. Only the parameters for levels thought to be cone-mediated are shown.

