. 2019 Jul 17;8:e46912. doi: 10.7554/eLife.46912

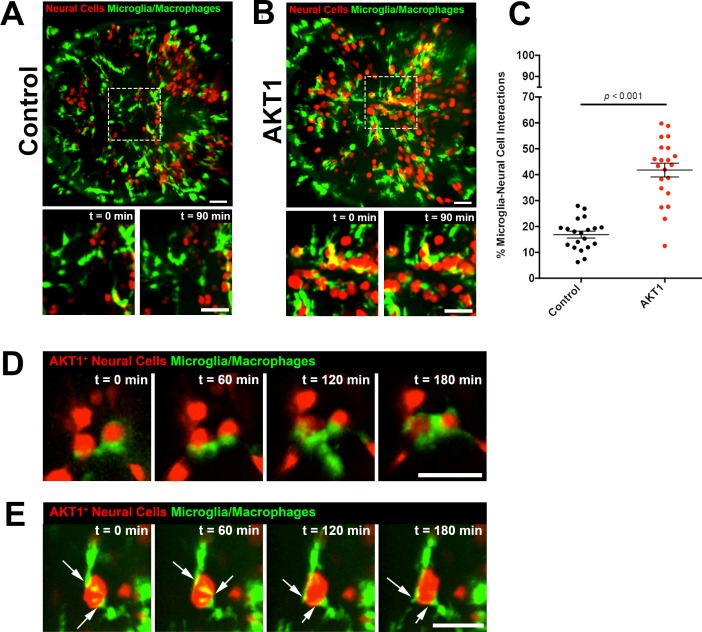
Figure 1. Microglia show increased interactions with AKT1 expressing cells compared to control cells.

In vivo time-lapse imaging was performed using the mpeg1:EGFP transgenic line to observe microglia behaviour towards control cells and AKT1 cells. (A) In controls, microglia were observed to behave physiologically. Cells adopted the typical ramified morphology constantly sending out branched processes to survey the microenvironment (see also Figure 1—video 1). (B) Following AKT1 overexpression, microglia were observed to directly interact with AKT1+ cells (see also Figure 1—video 2). (C) Quantification of the percentage of microglia interacting with control and AKT1 positive cells (control: 16.86 ± 1.33%, n = 20; AKT1: 41.79 ± 2.65%, n = 21). Specific microglia interactions with AKT1+ cells include (D) the wrapping of cell bodies around the oncogenic cells (see also Figure 1—video 3), as well as (E) two microglial cells making direct contacts with AKT1+ via their extended processes (white arrows) (see also Figure 1—video 4). Representative images at five dpf are shown. Images were captured using an Andor spinning disk confocal microscope with a 20x/0.75 objective. Image acquisition was carried out over a duration of 180 min (3 hr). Scale bars represent 30 µm. Error bars represent mean ± SEM.

Figure 1—source data 1. Quantfications of microglial interactions with control and AKT1+ cells.
DOI: 10.7554/eLife.46912.004

Figure 1.

Figure 1—figure supplement 1. Microglial responses to oncogenic cells.
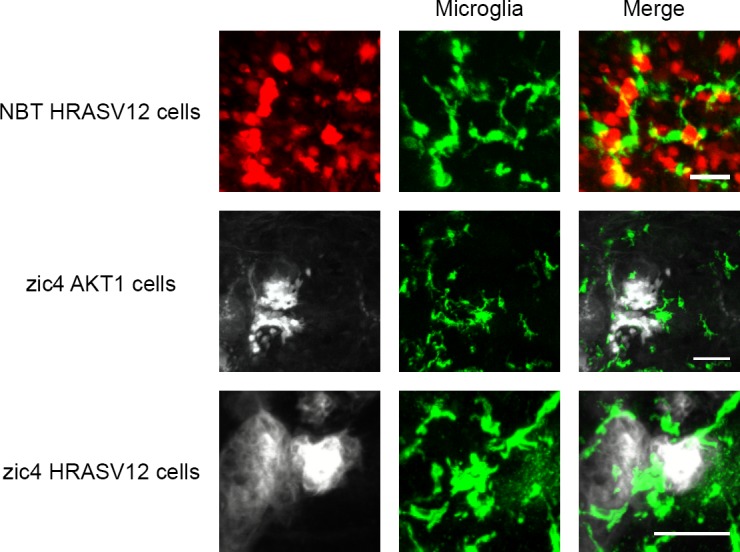
Figure 1—figure supplement 1.

Microglia were seen to directly interact with NBT cells and zic4 cells undergoing oncogenic transformation caused by AKT1 and HRAV12. Microglia were visualised using the mpeg1:EGFP line in NBT-HRASV12 and zic4-AKT1 larvae and visualised using the 4C4 antibody in the zic4-HRASV12 larvae. Representative images at six dpf are shown. Images were captured using an Andor spinning disk confocal microscope with a 20x/0.75 objective and a Zeiss LSM 710 confocal microscope with a 20x/0.8 objective. Scale bars represent 40 µm for NBT HRASV12 larvae and 50 µm for zic4 larvae.
Figure 1—video 1. Microglia responses to control RFP neural cells (REF to Figure 1).
Download video file (2.3MB, mp4)
DOI: 10.7554/eLife.46912.005
In vivo time-series showing representative microglia (green) behaviour in the presence of control neural cells (red). Images were acquired every 2 min over a duration of 180 min (3 hr) using an Andor spinning disk confocal microscope with a 20x/0.75 objective. Scale bar represents 30 µm.
Figure 1—video 2. Microglia display close interactions with AKT1 expressing cells (REF to Figure 1).
Download video file (2.2MB, mp4)
DOI: 10.7554/eLife.46912.006
In vivo time-series showing representative microglia (green) behaviour in the presence of AKT1 positive cells (red). In comparison to controls, the microglia were observed to keep in close contact with the AKT1 expressing cells over long periods of time. Images were acquired every 2 min over a duration of 180 min (3 hr) using an Andor spinning disk confocal microscope with a 20x/0.75 objective. Scale bar represents 30 µm.
Figure 1—video 3. Microglia display close interactions with AKT1 expressing cells (REF to Figure 1).
Download video file (1MB, mp4)
DOI: 10.7554/eLife.46912.007
In vivo time-series showing representative microglia (green) behaviour in the presence of isolated AKT1 positive cells (red). Microglia were observed to contact different oncogenic cells and to flatten their surfaces and wrap their cell bodies around the oncogenic cells over long periods of time. Images were acquired every 2 min over a duration of 180 min (3 hr) using an Andor spinning disk confocal microscope with a 20x/0.75 objective. Scale bar represents 5 µm.
Figure 1—video 4. Different microglia interact with the same isolated AKT1 expressing cell (REF to Figure 1).
Download video file (1.6MB, mp4)
DOI: 10.7554/eLife.46912.008
In vivo time-series showing representative microglia (green) behaviour in the presence of isolated AKT1-positive cells (red). Different microglia were observed to make direct contacts with the same oncogenic cell via their extended processes over long periods of time. Images were acquired every 2 min over a duration of 180 min (3 hr) using an Andor spinning disk confocal microscope with a 20x/0.75 objective. Scale bar represents 10 µm.