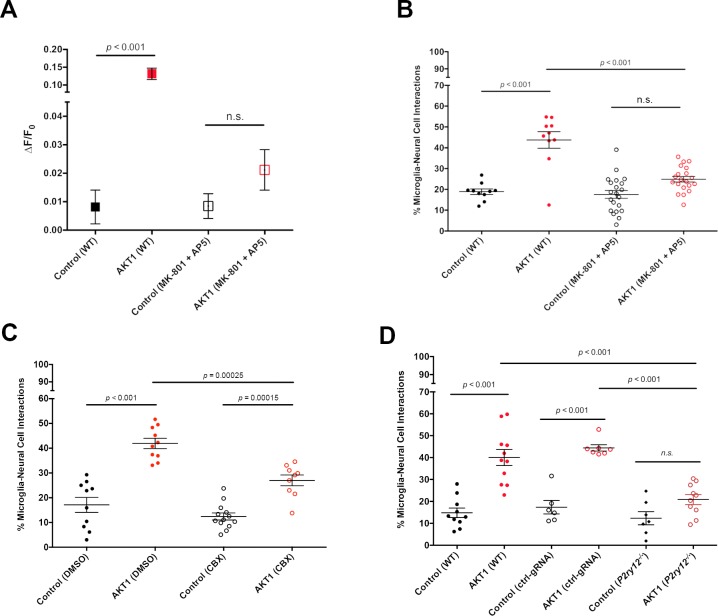
Figure 4. Ca2+-ATP-P2ry12 signalling stimulates microglial interactions with AKT1 cells.
The β-actin:GCaMP6f transgenic line was used to monitor and measure in vivo calcium (Ca2+) levels in control and AKT1 expressing cells. The mpeg1:EGFP transgenic line was used to quantify microglial interactions with control and AKT1 cells. (A) Treating larvae with MK801 and MK5 to inhibit NMDA receptor signalling led to a significant reduction of Ca2+ levels in treated AKT1 cells compared to untreated AKT1 cells. Quantification of the mean relative fluorescence intensity (∆F/F0) of Ca2+ levels in control and in AKT1 expressing cells is shown (control (WT): 0.0081 ± 0.006, n = 25; AKT1 (WT): 0.1316 ± 0.016, n = 32; control (MK801 +MK5): 0.0085 ± 0.004, n = 16; AKT1 (MK801 +MK5): 0.0211 ± 0.007, n = 16). (B) The percentage of microglial cells interacting with AKT1 cells was significantly reduced in larvae treated with MK801 and MK5 compared to untreated larvae. (Control (WT): 18.89 ± 1.32, n = 10; AKT1 (WT): 43.75 ± 3.95, n = 10; Control (MK801 +MK5): 17.59 ± 1.89, n = 21; AKT1 (MK801 +MK5): 24.94 ± 1.36, n = 20). (C) The percentage of microglial cells interacting with AKT1 cells was significantly reduced in larvae treated with CBX compared to untreated larvae (Control (DMSO): 17.11 ± 3.02%, n = 10; AKT1 (DMSO): 41.92 ± 2.09%, n = 10; Control (CBX): 12.42 ± 1.42%, n = 13; AKT1 (CBX): 26.99 ± 2.19%, n = 9).(D) The percentage of microglial cells interacting with AKT1 cells was significantly reduced in p2ry12 crispant larvae compared to WT larvae (Control (WT): 14.82 ± 2.19%, n = 10; AKT1 (WT): 40.01 ± 3.66%, n = 11; Control (ctrl-gRNA): 17.38 ± 3.09%, n = 6; AKT1 (ctrl-gRNA): 44.42 ± 1.46%, n = 7; Control (p2ry12-/-): 12.33 ± 2.97%, n = 7; AKT1 (p2ry12-/-): 20.88 ± 2.29%, n = 10).


