. 2019 Jul 10;8:e47454. doi: 10.7554/eLife.47454

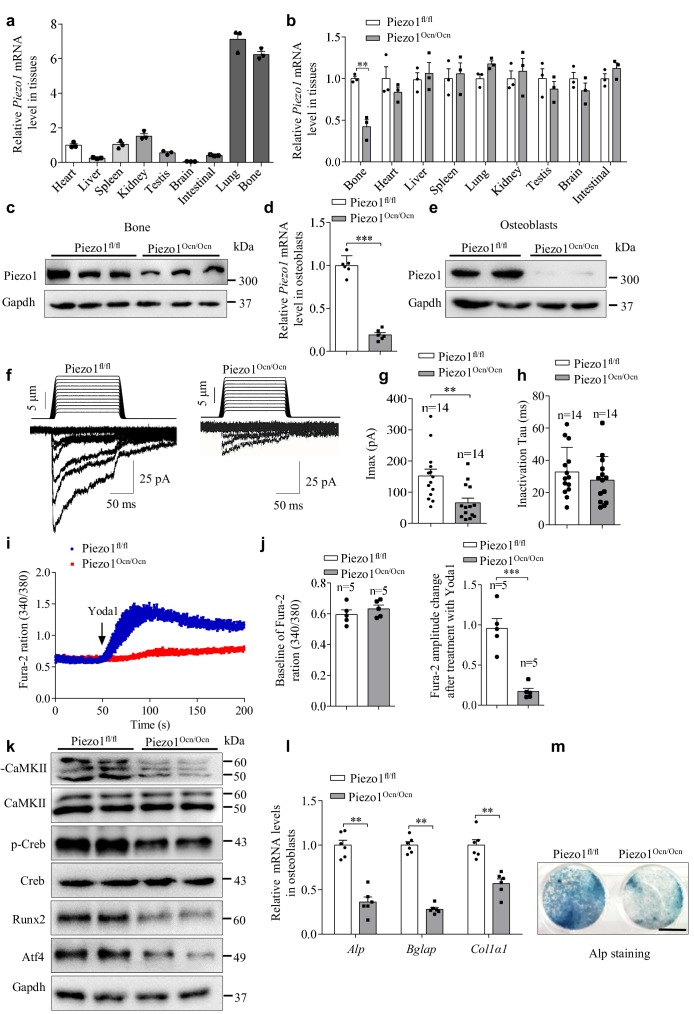
Figure 2. Expression and function of Piezo1 in primary osteoblasts isolated from Piezo1fl/fl and Piezo1Ocn/Ocn mice.

(a) QRT-PCR analysis of Piezo1 mRNA level in bone and other tissues from WT mice. (b) QRT-PCR analysis of Piezo1 mRNA level in different tissues from Piezo1fl/fl or Piezo1Ocn/Ocn mice. The Piezo1 mRNA level in all tissues from Piezo1Ocn/Ocn mice was normalized to that in Piezo1fl/fl mice. (c) Western blot analysis of Piezo1 protein level in bone tissues from Piezo1fl/fl and Piezo1Ocn/Ocn mice. (d) QRT-PCR analysis of Piezo1 mRNA level in primary osteoblasts isolated from Piezo1fl/fl or Piezo1Ocn/Ocn mice and cultured with osteogenic medium for 5 days. (e) Western blot analysis of Piezo1 protein level in primary osteoblasts cultured with osteogenic medium for 5 days. (f) Representative traces of poking-induced inward currents recorded at −60 mV in primary osteoblasts isolated from Piezo1fl/fl or Piezo1Ocn/Ocn mice. (g, h) Scatter plots of the maximal poking-induced currents (g) and inactivation tau (h) in primary osteoblasts isolated from Piezo1fl/fl or Piezo1Ocn/Ocn mice. (i) Average single-cell Ca2+ imaging traces of Piezo1fl/fl or Piezo1Ocn/Ocn osteoblasts showing the 340/380 ratio of the Ca2+-sensitive Fura-2 dye in response to the application of 30 μM Yoda1. (j) Scatter plot of baseline and Yoda1-induced Fura-2 amplitude changes in Piezo1fl/fl or Piezo1Ocn/Ocn osteoblasts. (k) Western blot analysis of p-CaMKII, CaMKII, p-Creb, Creb, Runx2 and Atf4 proteins in primary osteoblasts cultured with osteogenic medium for 5 days. (l) QRT-PCR analysis of Alp, Bglap and Col1α1 mRNA levels in primary osteoblasts cultured with osteogenic medium for 5 days. (m) Representative images of Alp staining in primary osteoblasts cultured with osteogenic medium for 5 days. Scale bar, 5 mm. The staining data were confirmed by three repeated tests. All data are the mean ± s.e.m. from three independent experiments. **, p<0.01; ***, p<0.001.

Figure 2—source data 1. The expression and function of Piezo1 in primary osteoblasts isolated from Piezo1fl/fl and Piezo1Ocn/Ocn mice.
DOI: 10.7554/eLife.47454.009

Figure 2.

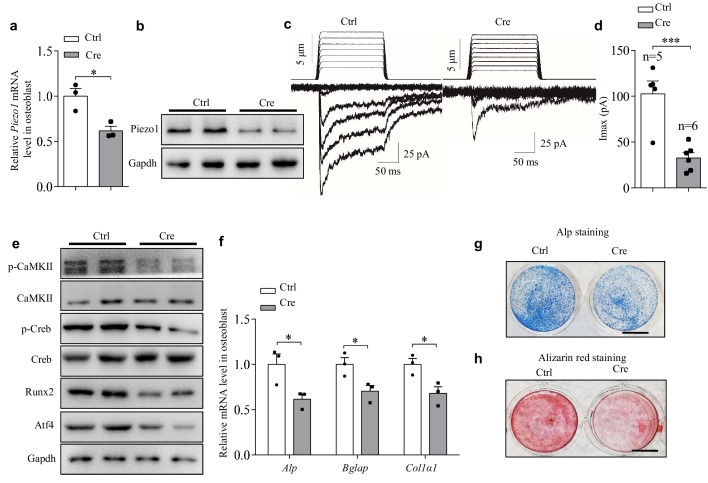
Figure 2—figure supplement 1. Characterizations of primary osteoblasts derived from Piezo1fl/fl mice with or without ectopic expression of the Cre recombinase.

Figure 2—figure supplement 1.

(a, b) QRT-PCR analysis of Piezo1 mRNA level (a) and western blot analysis of Piezo1 protein level (b) in osteoblasts derived from Piezo1fl/fl mice after transfection with pIRES-EGFP (Ctrl) or pCAG-Cre-IRES2-GFP (Cre) plasmid. (c) Representative traces of poking-induced inward currents recorded at −60 mV in an osteoblast from Piezo1fl/fl mice after transfection with Ctrl or Cre plasmid. Cells with green fluorescence were used to record current. (d) Scatter plots of the maximal poking-induced currents in osteoblasts from Piezo1fl/fl mice after transfection with Ctrl or Cre plasmid. (e) Western blot analysis of p-CaMKII, CaMKII, p-Creb, Creb, Runx2 and Atf4 proteins in osteoblasts from Piezo1fl/fl mice after transfection with Ctrl or Cre. (f) QRT-PCR analysis of Alp, Bglap and Col1α1 mRNA levels in osteoblasts from Piezo1fl/fl mice after transfection with Ctrl or Cre plasmid. (g) Representative images of Alp staining in osteoblasts from Piezo1fl/fl mice after transfection with Ctrl or Cre plasmid in osteogenic medium for 5 days. Scale bar, 5 mm. (h) Staining of calcium deposition by Alizarin red in osteoblasts derived from Piezo1fl/fl mice after transfection with Ctrl or Cre plasmid in osteogenic medium for 14 days. Scale bar, 5 mm. All data are the mean ± s.e.m. from three independent experiments. *, p<0.05; ***, p<0.001.
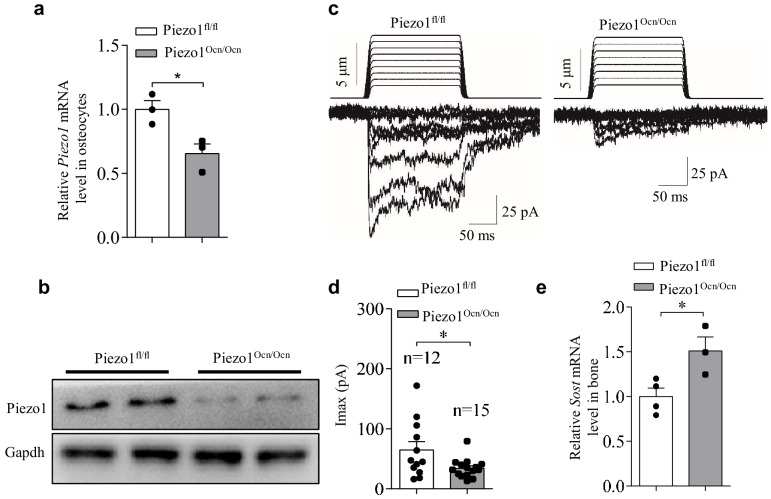
Figure 2—figure supplement 2. Expression and function of Piezo1 in osteocytes isolated from Piezo1fl/fl and Piezo1Ocn/Ocn mice.

Figure 2—figure supplement 2.

(a, b) QRT-PCR analysis of Piezo1 mRNA level (a) and western blot analysis of Piezo1 protein level (b) in osteocytes from Piezo1fl/fl and Piezo1Ocn/Ocn mice. (c) Representative traces of poking-induced inward currents recorded at −60 mV in osteocytes from Piezo1fl/fl and Piezo1Ocn/Ocn mice. (d) Scatter plots of the maximal poking-induced currents in osteocytes from Piezo1fl/fl and Piezo1Ocn/Ocn mice. (e) QRT-PCR analysis of Sost mRNA levels in bone tissues from Piezo1fl/fl and Piezo1Ocn/Ocn mice. All data are the mean ± s.e.m. from three independent experiments. *, p<0.05; **, p<0.01.