. 2019 Jul 29;8:e48788. doi: 10.7554/eLife.48788

Figure 8. Distinct transcription factor requirements in the formation of ascending and descending 5-HT projection pathways.

(A) TdTomato+ axon innervation in Pet1cKO vs control spinal cords in 3 month old mice. Coronal semi-section views of cervical and lumbar levels. Scale bars, 200 µm. cc, central canal; dh, dorsal horn; vh, ventral horn; fun, funiculi. (B) Quantification of TdTomato+ axons (pixels/µm2) in cervical and lumbar spinal cords (n = 3, controls; n = 3, Pet1cKO animals; Two-way ANOVA; white matter: cervical p=0.1372; lumbar p=0.6764; gray matter: cervical p=0.4440; lumbar p=0.1995). Data are represented as mean ± SEM. (C) Decreased TdTomato+ arbors detected in Pet1cKO hippocampus compared to controls at 3 months of age. Scale bars, 200 µm, sagittal view. (D) Decreased TdTomato+ arbors detected in Pet1cKO cortex compared to controls at 3 months of age. Scale bars, 100 µm, coronal view. (E) Decreased TdTomato+ arbors detected in Pet1cKO olfactory bulb compared to controls at 3 months of age. Scale bars, 50 µm, sagittal view. cg, cingulum; cc, corpus callosum; LSM, lacunosum moleculare; DG, dentate gyrus; CA1 of hippocampus; gr, granule layer; gl, glomerular layer.

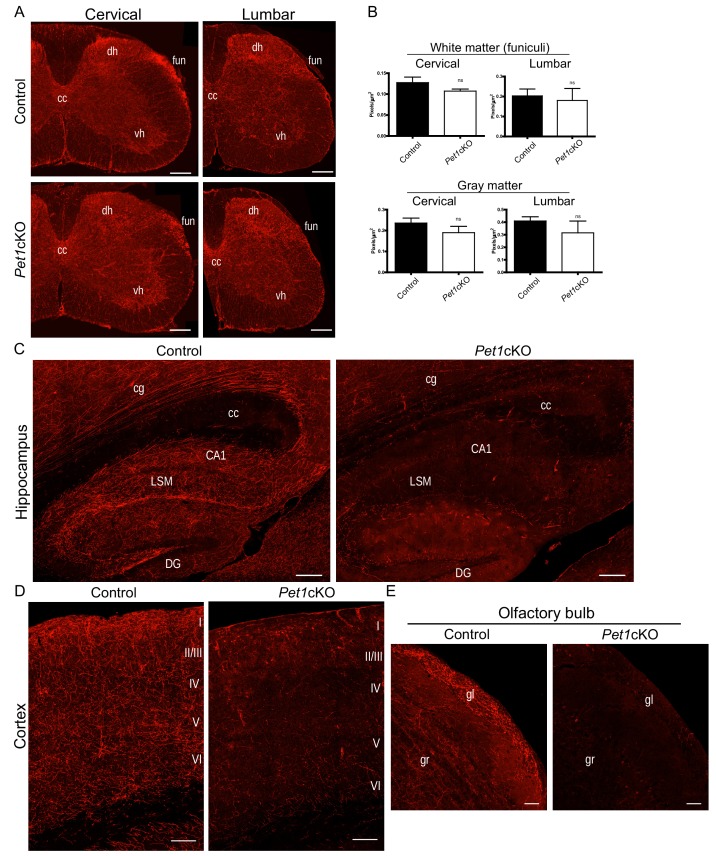
Figure 8.

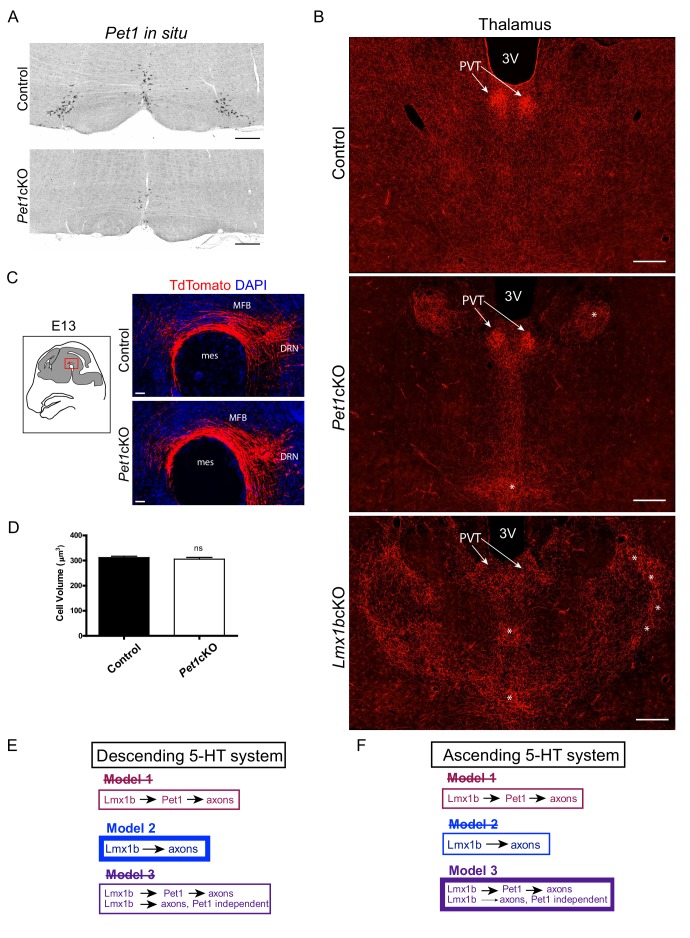
Figure 8—figure supplement 1. Pet1cKO and Lmx1bcKO mice exhibit distinct axon defects in thalamus.

Figure 8—figure supplement 1.

(A) Pet1 ISH shows Pet1 was targeted in medullary neurons of Pet1cKO mice. Scale bars, 200 µm. (B) Distinctly different clumping pattern in Pet1cKO thalamus (asterisks) compared to Lmx1bcKO thalamus. Patterning in the PVT was normal in Pet1cKO mice (arrows). Scale bars, 200 µm. (C) No differences in early embryonic (E13.5) primary growth through the MFB in Pet1cKO embryos. Scale bars, 50 µm. (D) Cell volume analysis in Pet1cKO DRN revealed no significant difference in cell body size (n = 587 control cells; n = 549 Pet1cKO cells, p=0.4745). Compare to Lmx1bcKO cell volume, see Figure 1—figure supplement 1J. Unpaired t-test with Welch's correction. Data are represented as mean ± SEM. (E) Scheme illustrating evidence-supported model for control of descending 5-HT axon development (Model 2). (F) Scheme illustrating evidence-supported model for control of ascending 5-HT axon development (Model 3).
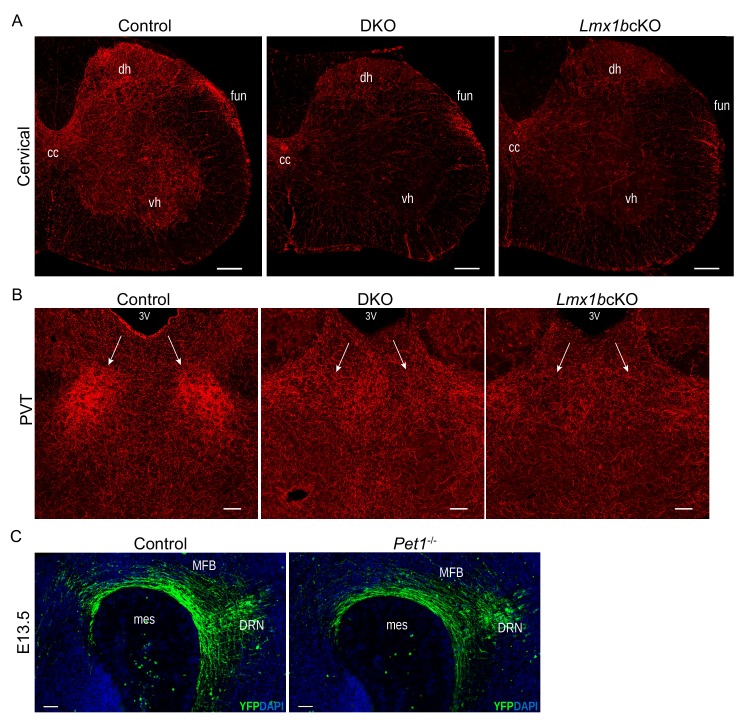
Figure 8—figure supplement 2. DKO and Pet1-/- analyses.

Figure 8—figure supplement 2.

(A) Similar 5-HT axons defects in spinal cord of DKO and Lmx1bcKO mice (n = 3 mice/genotype). Scale bars, 200 µm. cc, central canal; dh, dorsal horn; vh, ventral horn; fun, funiculi. (B) DKO PVT was unarborized similar to Lmx1bcKO PVT (n = 3 mice/genotype). Scale bars, 100 µm. PVT, paraventricular nucleus of the thalamus; 3V, third ventricle. (C) Immunolabeled YFP+ axons in Pet1-/- embryos at E13.5 showed no deficit in primary ascending axon growth through the MFB (n = 2 mice/genotype). Scale bars, 50 µm. MFB, medial forebrain bundle; mes, mesencephalic flexure.