Figure 4.
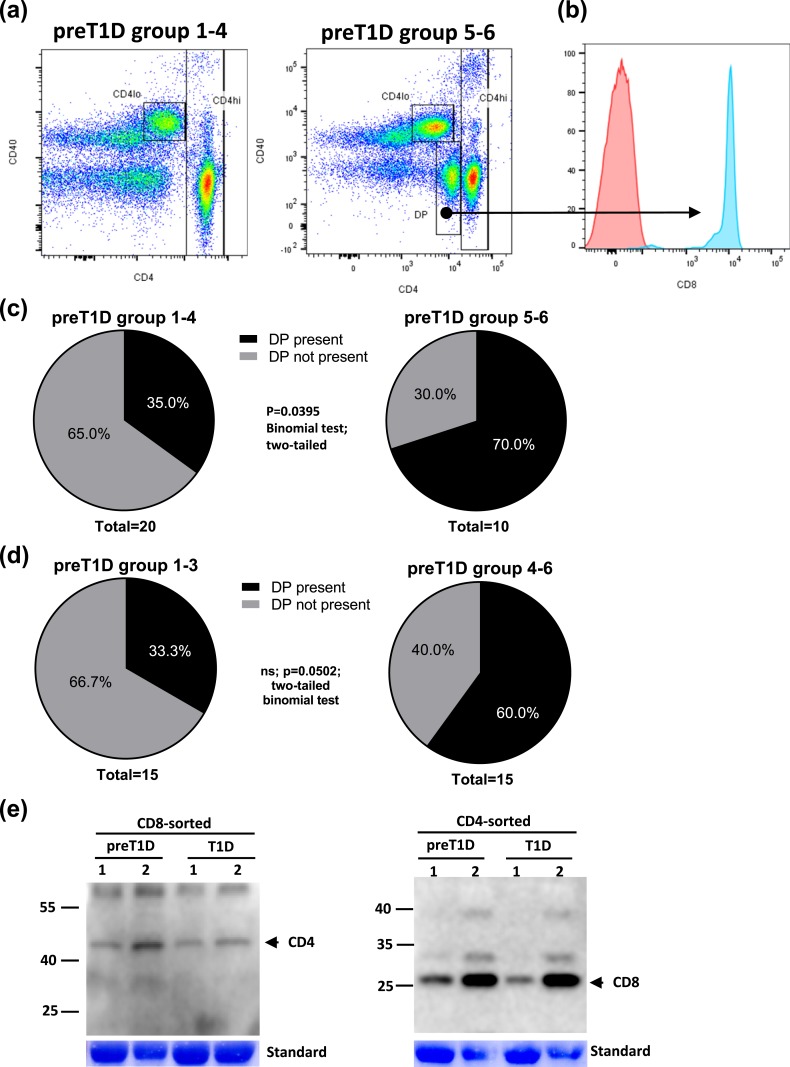
Stratified preT1D groups demonstrated differences in the presence of CD4/CD8 DP cells. PreT1D subjects were stratified into groups as shown in Table 2, then subjects in groups 1 through 4 were compared with subjects in groups 5 and 6. PBMCs were stained for CD4, CD3, CD8, and CD40. Cells were gated on FSC and SSC for live cells, then CD4 and CD40 were plotted and gated on the basis of isotype controls, and CD3 expression was confirmed. (a) Representative CD4/CD40 dot plots from groups 1 through 4 (left) and groups 5 and 6 (right). (b) Histogram depicting CD8 content in the CD4 intermediate population [arrow from dot plot in (a)] from groups 5 and 6. (c) Pie charts representing the number of subjects with and without DP population in groups 1 through 4 (left) and groups 5 and 6 (right). (d) Pie charts representing the number of subjects with and without DP population in groups 1 through 3 (left) and groups 4 through 6 (right). (e) PBMCs from two preT1D samples and two long-standing T1D samples were assayed in western blots for CD4 (left) and CD8 (right) after sorting on CD8 and CD4, respectively, was performed. Significant differences in the data presented in (c) and (d) were calculated by two-tailed binomial test. ns, not significant.

