Figure 8.
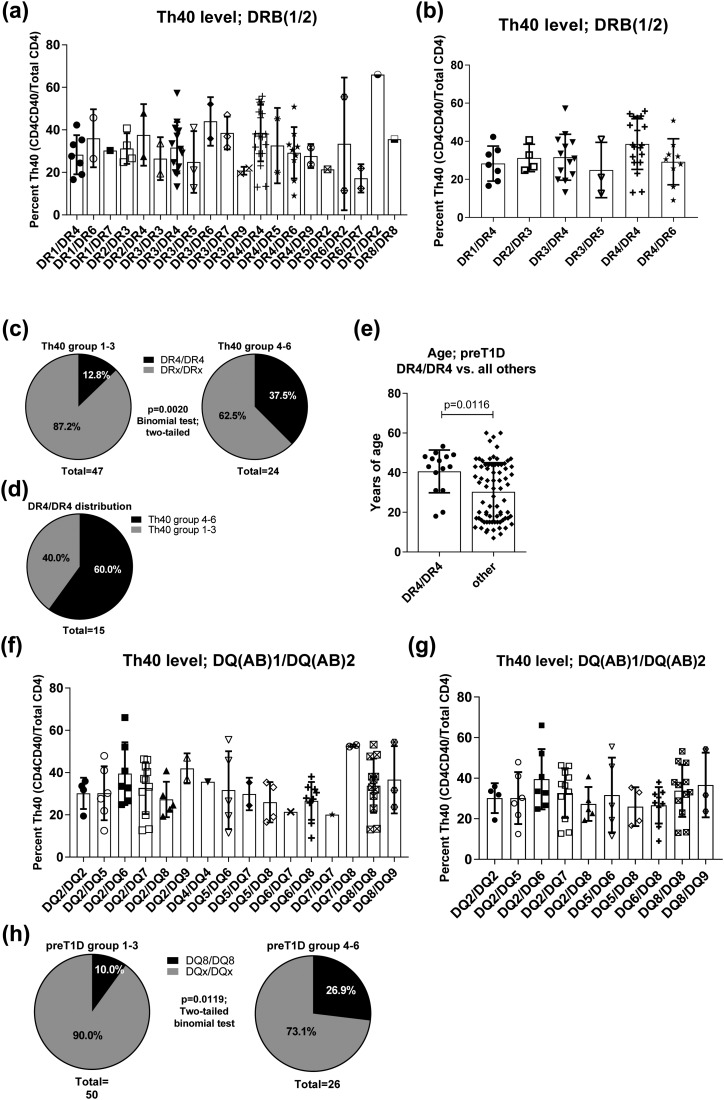
HLA DR4/DR4 and DQ8/DQ8 were more prevalent in preT1D subjects with higher Th40-cell levels. Th40-cell levels in preT1D subjects were plotted according to HLA-DR haplotypes for (a) all subjects or (b) HLA-DR haplotypes represented by more than two subjects. (c) PreT1D subjects were stratified into groups as shown in Table 2, then subjects in groups 1 through 3 (left) were compared with subjects in groups 4 through 6 (right) for the representation of HLA DR4/DR4 vs all other DR-haplotypes (DRx/DRx). (d) Distribution of DR4/DR4 subjects only among preT1D groups 1 through 3 and 4 through 6. (e) Graph depicting the age of DR4/DR4 subjects compared with all other haplotype subjects. (f) Th40-cell level according to HLA-DQ haplotype in all subjects or (g) HLA-DQ haplotypes represented by more than two subjects. (h) PreT1D subjects were stratified into groups as shown in Table 2, then subjects in groups 1 through 3 (left) were compared with subjects in groups 4 through 6 (right) for the representation of HLA DQ8/DQ8 vs all other DQ-haplotypes (DQx/DQx). Significant differences in the data presented in (c) and (h) were calculated by two-tailed binomial test and in (e) by two-tailed t test.

