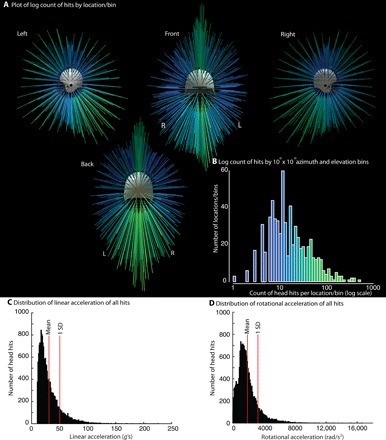
Fig. 1. Visualization of spatial distribution of head hits in 38 collegiate football players (RSHI cohort) in a season of play.

(A) Plot of log count of hits by location/bin. Azimuth (longitude) and elevation (latitude) were binned into 10° square bins (36 bins for 360 azimuth and 18 bins for 180° elevation). At each location/bin, the total number of hits was counted across all 38 players in the RSHI cohort. Because the distribution of hit count was strongly right skewed (higher counts for fewer number of hits per location/bin), the log10 of the count data was computed. The results are displayed in (A) as vectors, where the color and length of each vector scale by the log of the count of hits at that location. (B) Log count of hits by 10° × 10° azimuth and elevation bins. The histogram plots (y axis) the number of locations/bins at which (x axis) different numbers of hits were observed. Coloring on the histogram serves as a color scale for the data displayed in (A). (C) Histogram of distribution of linear acceleration for all hits. (D) Histogram of distribution of rotational acceleration for all hits. An interactive model of the data shown in (A) can be found at www.openbrainproject.org/tbi.
