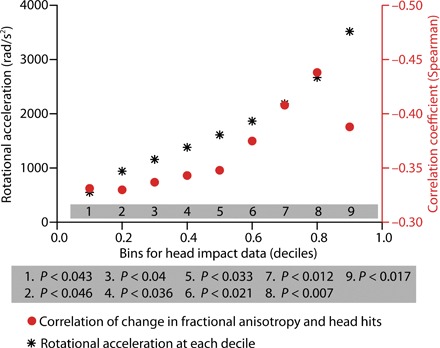
Fig. 4. Control analyses ensured that the relation between rotational acceleration and changes in FA does not depend on thresholds.

The plot shows (black stars) the rotational acceleration values corresponding to decile binning of the data. For each decile, the correlation between the number of hits (at that threshold or higher) and changes in FA was computed (filled red circles). Regardless of the threshold used, there was a significant correlation between changes in FA and number of head hits.
