
Fig. 6. SVR analysis relating the spatial fingerprint of head impacts to hemispheric asymmetries in white matter.
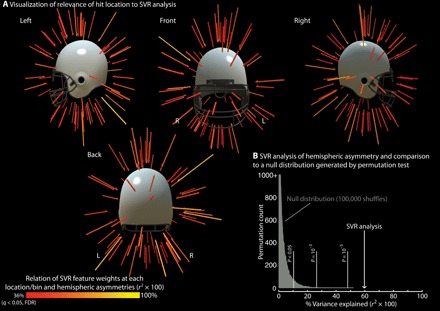
Each player has a “spatial fingerprint” of the distribution of hits around the head over the entire season. That pattern was used to train a linear SVR model to predict variance across participants in hemispheric asymmetries in white matter changes. (A) Visualization of relevance of hit location to SVR analysis. The images are a graphical representation of the SVR model relating variance across participants in the spatial distribution of hits to variance across participants in the laterality of white matter changes. This visualization of the SVR analysis was computed by correlating the variance across participants in feature weights (at each location/bin) with the variance across participants in hemispheric asymmetries in white matter changes. The results are plotted as vectors that are scaled in length and color by variance explained (Bonferroni thresholded at 05/648 = 0.00007, or a critical r2 of 0.36). (B) SVR analysis of hemispheric asymmetry and comparison. Using an n − 1 cross-validation approach, a linear SVR model captures 60% of the variance in hemispheric asymmetries in white matter changes. The variance explained by this analysis differs significantly from chance, as shown through permutation testing (100,000 shuffles). An interactive model of the data shown in (A) can be found at www.openbrainproject.org/tbi. FDR, false discovery rate.