
Fig. 4. Large overlap between Bcl11b- and Foxp3-occupied sites in Treg cells.
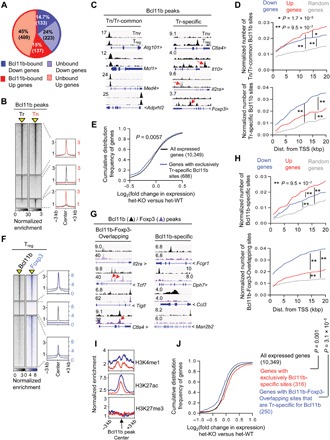
ChIP-seq was performed for Bcl11b on sorted CD4+Foxp3+ Treg (Tr) and CD4+Foxp3−CD62lhi T naïve (Tn) cells. (A) Overview of the percentage of Bcl11b-dependent Up or Down genes bound by Bcl11b within ±20 kb of their transcription start sites (TSSs). (B) Genome-wide occupancy of Bcl11b in Tr and Tn cells. Each column depicts Bcl11b binding in Tr or Tn cells within a window ±3 kb centered around Bcl11b-bound sites (indicated as a yellow triangle). Normalized enrichments of indicated Bcl11b-bound peak sets are shown on the right as histogram plots. (C) Representative tracks, as viewed in Integrative Genome Viewer (IGV), of Bcl11b ChIP-seq reads aligned to the corresponding gene loci. Y scale is normalized tag intensity (reads per million mapped reads). Red arrows point toward peaks in each category that are otherwise not obvious. (D) Plots depicting enrichment of Tn/Tr-common (top) or Tr-specific (bottom) sites within a given distance to promoter of randomly selected genes, or genes that are down-regulated or up-regulated in Bcl11b-deficient Treg cells. Wilcoxon rank-sum test P values are shown. (E) CDF analysis of gene expression changes between Bcl11b-deficient versus Bcl11b-sufficient Treg cells for gene subsets that “exclusively” contain Tr-specific Bcl11b-specific sites. Of note, there was a subcategory of genes prebound by Bcl11b in Tn and gained new Bcl11b peaks at different site(s) in Tr. While these genes are also categorized as Tr-specific site–containing genes, they are not included in this analysis. Two-tailed Kolmogorov-Smirnov test P value is shown. (F) Genome-wide occupancy of Bcl11b and Foxp3 in Treg cells. Each column depicts Bcl11b or Foxp3 binding within a window ±3 kb centered on peaks identified by ChIP-seq analyses (indicated as a yellow triangle). Normalized enrichments of indicated Bcl11b- and Foxp3-bound peak sets are shown on the right as histogram plots. (G) Examples of Bcl11b- and Foxp3-bound peaks representing common sites (Bcl11b-Foxp3-Overlapping) or sites where Bcl11b binds in the absence of Foxp3 (Bcl11b-specific). (H) Plots depicting enrichment of Bcl11b-specific (top) or Bcl11b-Foxp3-Overlapping (bottom) sites within a given distance to promoter of randomly selected genes, or genes that are down-regulated or up-regulated in Treg cells in the absence of Bcl11b. (I) Normalized enrichment of indicated chromatin marks around Bcl11b binding sites within ±20 kb of TSS for the gene subsets analyzed. The blue line represents genes with Bcl11b-Foxp3-Overlapping sites that are Tr-specific for Bcl11b. The red line represents genes that are only bound by Bcl11b in Treg cells. (J) CDF analysis of gene expression changes between Bcl11b-deficient versus Bcl11b-sufficient Treg cells for indicated gene subsets. Genes that are bound by both Bcl11b and Foxp3, but at two different sites (nonoverlapping), are excluded from this analysis. Two-tailed Kolmogorov-Smirnov test P values are shown.