
Fig. 5. Foxp3 promotes functional recruitment of Bcl11b in Treg cells.
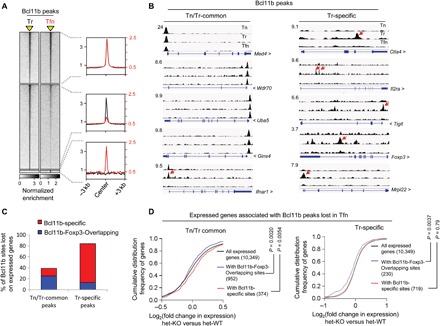
(A) Genome-wide occupancy of Bcl11b in WT Treg (Tr) and Tfn cells derived from Foxp3GFPKO mice. Bcl11b binding within a window ±3 kb centered on peaks identified by ChIP-seq analyses (indicated as a yellow triangle). Normalized enrichments of indicated Bcl11b peak sets are shown on the right as histogram plots. (B) Examples of Bcl11b peaks in Tn, Tr, and Tfn cells as viewed in IGV, representing the indicated categories. Red arrows indicate peaks that are significantly reduced in Tfn cells compared to Tr. (C) Graphical representation summarizing the subcategories to which the Bcl11b peaks lost in Tfn cells belong. (D) CDF analysis of gene expression changes between Bcl11b-deficient versus Bcl11b-sufficient Treg cells for indicated gene subsets. Two-tailed Kolmogorov-Smirnov test P values are shown.