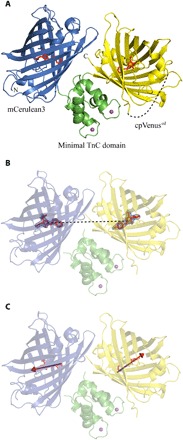
Fig. 1. Cartoon representation of the x-ray structure of Twitch-2B.

(A) The fluorophores of mCerulean3 and cpVenuscd are depicted as stick structures in red. The calcium ions of the minimal TnC domain are shown as magenta spheres. The disordered linker connecting the original N and C termini of Venus is shown as a dashed line. (B) The distance between the centers of mass of the two fluorophores of Twitch-2B is depicted as a dashed line. (C) The transition dipole moments of the two fluorophores of Twitch-2B as obtained from (15) are depicted as arrows.
