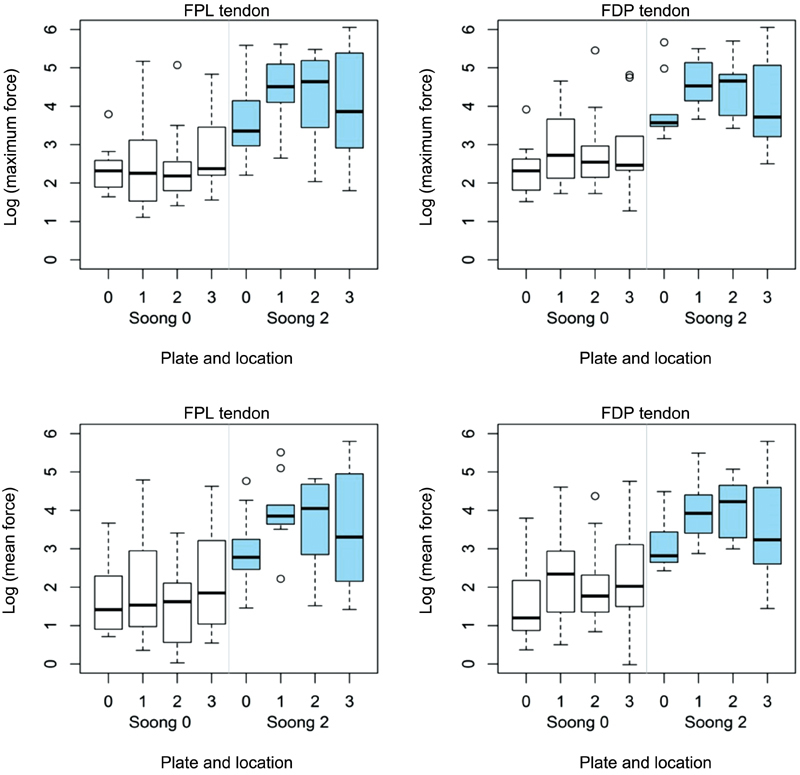
Fig. 5.

Boxplots show the log transformed values of maximum and mean force on FPL and FDP tendons by plate type and location. Force was log transformed. Plate 0: no plate; plate 1: Adaptive plate; plate 2: FPL plate; PLate 3: Babyfoot plate. FDP, flexor digitorum profundus; FPL, flexor pollicis longus.
