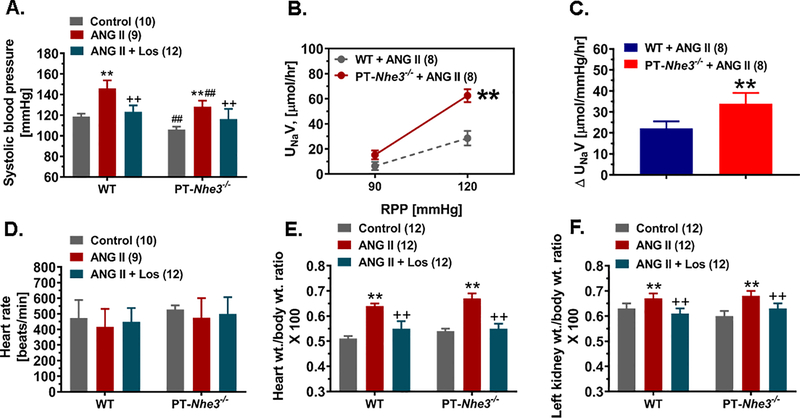
Figure 3.
The hypertensive (A) and pressure-natriuresis (B,C), heart rate (D), and heart (E) or kidney wt. (F) to body wt. ratio responses to a slow and low pressor dose of ANG II infusion, 0.5 mg/kg/day, i.p., and 2% NaCl diet for 2 weeks in male WT and PT-Nhe3−/− mice. Please note that the hypertensive response to ANG II was significantly attenuated in PT-Nhe3−/− mice, compared with WT mice (P<0.01). In response to an increase of ~30 mmHg in renal perfusion pressure (RPP), the pressure-natriureiss response increased ~4-fold in WT mice, whereas the response increased ~6.5-fold in PT-Nhe3−/− mice (**P<0.01). Both net urinary Na+ excretion (not shown) and as a fraction to a 10 mmHg increase in RPP were significantly higher in PT-Nhe3−/− mice (p<0.01; n=8) than in WT mice (p<0.01; n=8). There were no significant differences in heart rate, heart wt. or kidney wt. to body wt. ratio responses between WT and PT-Nhe3−/− mice. **P<0.01 vs. control, basal or WT mice; ++P<0.01 vs. ANG II; ##P<0.01 vs. WT corresponding treatment groups.

