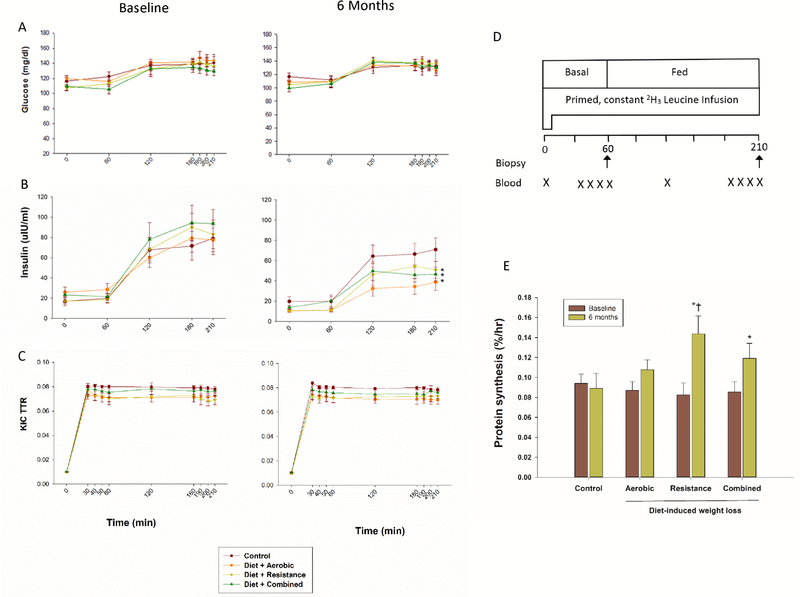
Figure 2. Muscle Protein Metabolism Studies.
Glucose concentrations (Panel A), insulin concentrations (Panel B), and α-ketoisocaproic acid (KIC) enrichments (Panel C) during the stable isotope infusion in basal (post-absorptive) conditions and mixed meal feeding before and at 6 months of diet-induced weight loss plus different types of exercise interventions in obese older adults. Outline of the protocol (Panel D). Muscle protein synthesis rate during mixed meal feeding before and at 6 months of interventions (Panel E). Muscle protein synthesis rate was calculated using muscle tissue fluid as precursor pool for protein synthesis. Between-group differences in changes from baseline: * p <0.05 for comparison with changes in Control group, † p<0.05 for comparison with changes in Aerobic group. I bars indicate standard errors, n = 11–12/group. Please see also Tables S1 and S2, and Figure S1.

