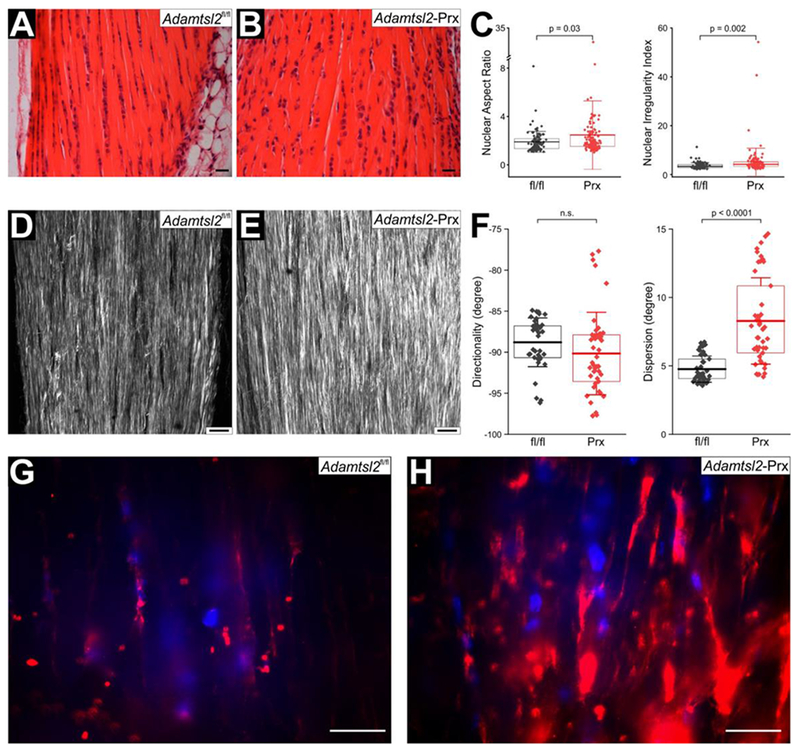
Figure 5. Disorganization of tenocyte arrays and extracellular matrix in Adamtsl2-Prx tendon.

(A, B) Hematoxylin & eosin staining of longitudinal sections through Achilles tendon show disturbance of linear tenocyte arrays in Adamtsl2-Prx tendon. Images shown are representative of n=3 littermates per genotype. (C) Quantification of nuclear aspect ratio and nuclear irregularity index from DAPI-stained sections from Adamtsl2fl/fl (n= 104) and Adamtsl2-Prx (n=135) tendons show significant differences suggesting altered cell shape. P-values were calculated with 2-sided Student t-test. The box indicates the 25th-75th percentile, the line indicates mean value and whiskers indicate standard deviation. (D, E) Second harmonic generation imaging of collagen fibers shows more intense collagen signal and disorganized collagen fibers in the absence of ADAMTSL2. Images shown are representative of n=3 littermates. (F) Quantification of directionality and dispersion of the collagen fibers in Adamtsl2fl/fl (n= 42 optical sections) and Adamtsl2-Prx (n=47 optical sections) after Fourier transformation show no changes in overall direction, but a significantly higher dispersion of directionality angles. P-values were calculated with 2-sided Student t-test. n.s.; not significant. The box indicates the 25th-75th percentile, the line indicates mean value and whiskers indicate standard deviation. (G, H) Fibrillin-1 (FBN1) staining is cell-associated, and stronger in Adamtsl2-Prx tendons. Images shown are representative of n=3 littermates. Scale bars represent 20 μm.
