
Figure 1.
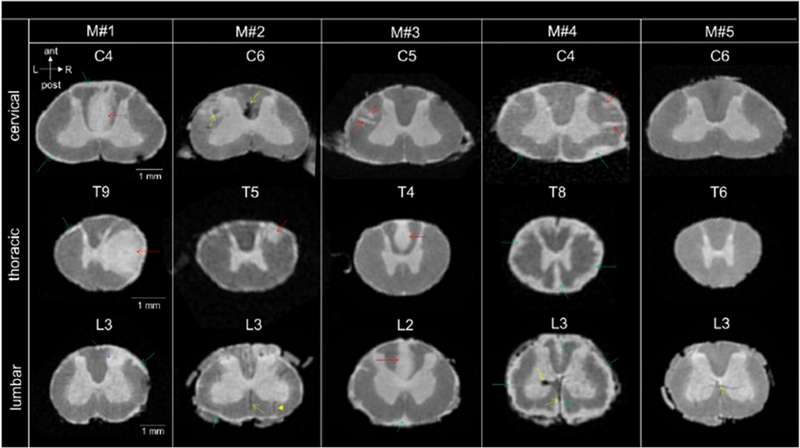
High-resolution postmortem MRI scans of four marmoset spinal cords with EAE (M#1, M#2, M#3, M#4) and one healthy control (M#5) showing cervical, thoracic, and lumbar spinal cord levels. Anatomical orientation axes are included (white arrows): anterior (ant), posterior (post), left (L) and right (R). The heterogeneity of the focal lesions (red arrows) and subpial lesions (green arrows) in terms of size, shape and location can be observed across the marmosets with EAE. Areas of hypointense signal (yellow arrows) were sometimes observed in these animals (M#2, C6 and M#4, L3), most likely originating from blood deposits (see Supplementary Figure 4). Parenchymal vessels with deoxygenated blood could also be visualized as dark thin lines (yellow dotted arrows, L3 for M#2, M#4 and M#5), sometimes running centrally through a focal lesion (plain yellow arrow, M#2, L3). Note the mass effect produced by a large tumefactive lesion (M#1, T9, red arrow) that involves most of the right lateral column and some of the GM. Another lesion affecting the GM (purple arrow) coud also be found within the dorsal horn at the lumbar level (M#1, L3). Various degree of confluence for the subpial lesions can be appreciated. For three animals (M#1, M#2, M#3), subpial lesions were subtle and not confluent compared to animal M#4 that displayed partially confluent (C4) and completelely confluent at the lower levels of the SC (T8 and L3).