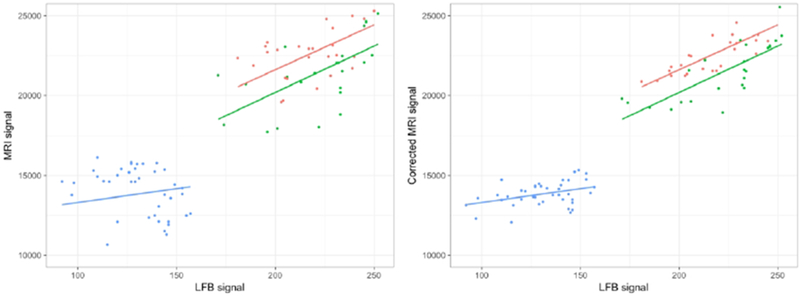
Figure 5.

Left: relationship between the observed MRI signal intensity values and LFB signal intensity using myelin model M2. Each dot represents the individual ROI values according to their tissue type. The fitted line represents the estimated MRI values for fixed effect only. Right: representation of the random effect correction on the MRI value estimations. The corrected MRI signal was obtained by removing the estimated random effect value from the mixed effect model for each section. The residual variation, which is neither explained by fixed effect nor random effect, is shown by the distance between the individual dot and its corresponding value within the fitted line. Green: lesion; red: gray matter; blue: NAWM.
