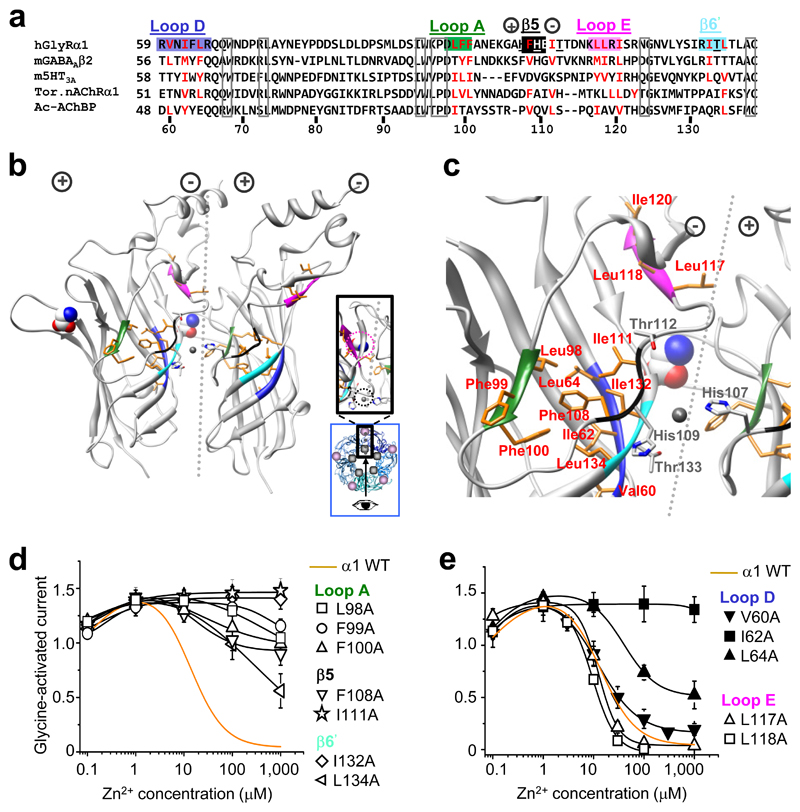
Figure 1. Hydrophobic determinants of Zn2+ inhibition.
(a) Partial protein alignment of Cys–loop receptor ECDs showing: GlyR α1 hydrophobic residues that are examined (red); where hydrophobicity is retained in other Cys–loop receptors (red); conserved residues (boxed); and the GlyR Zn2+ inhibition binding site residues (underlined). Hydrophobic motifs are labelled and colour–coded in accordance with (b, c), the GlyR α1 ECD homology model based on TornAChRα1 1. Clustered hydrophobic residues (orange) connect the Zn2+ inhibition site at the inner–subunit interface (black and light blue motifs – note, black motif is not a β–strand in the model but referred to as such in main text for clarity 2), to glycine binding loops A (green), D (dark blue) and E (mauve) of outer–subunit interface. Zn2+ inhibition site residues, His107, His109, Thr112 and Thr133, are in grey (nitrogen atoms are blue and oxygens are red). Dotted line depicts the interface with (+) and (–) subunit sides 28. Glycine, displayed in CPK, spacefill, was fitted manually in accordance with 35; Zn2+, fitted manually, in grey, spacefill. Exact side chain orientations presented here are speculative, based on best alignment and modelling estimations. Inset, blue box – pentamer plan view showing viewing angle (arrow) for main picture, and revealing the separation between the Zn2+ binding site (grey circle) and glycine binding site (mauve circle); enlarged plan view of interface shown in black box. (d, e) Zn2+ concentration response curves for modulation of EC50 glycine currents on wild–type (WT; dashed line) and alanine–substituted receptors. α1I120A did not traffic to cell surface so no recordings were made (Supplementary Figure 2). Curves fitted with Hill equation. All points are means ± s.e.m. (n = 3–6).

