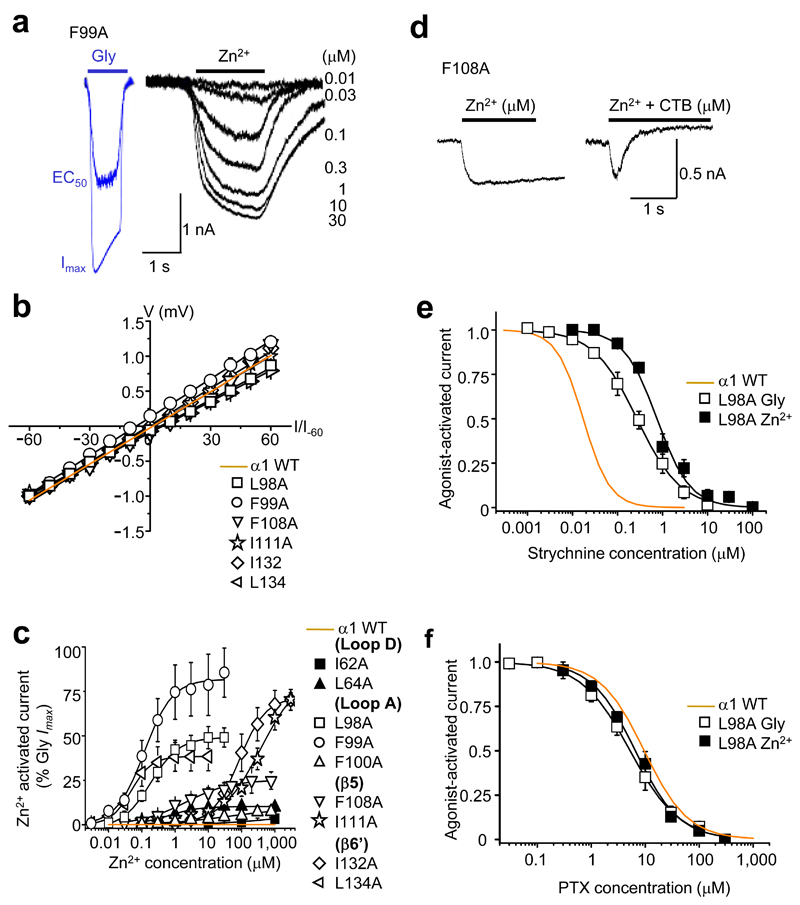
Figure 2. Direct Zn2+ activation of substituted GlyRs.
(a) Representative glycine currents (blue traces) in the absence of Zn2+ (EC50 – 30 μM; Imax – 1000 μM) and Zn2+ currents (black traces) in absence of glycine (0.01 – 30 μM) for GlyR α1F99A. (b) Zn2+ current–voltage (I–V) relationships (normalised to the current recorded at –60 mV and fitted by linear regression) for the six most efficacious ZAGs, where EC50 Zn2+ responses were large enough to be recorded reliably, and for the wild–type (WT) receptor. (c) Zn2+ activation–response curves for alanine–substituted GlyRs; Zn2+ maxima are normalised to glycine maxima (10 mM) in same cell. (d) Representative α1F108A Zn2+ Imax (100 μM) current co–applied with and without 20 μM CTB. Inhibition greater than 100% is due to additional background leak (discussed later in Fig. 6). (e, f) α1L98A concentration inhibition curves for strychnine and picrotoxin, respectively on glycine or Zn2+ EC50–activated currents (n = 3 –6). Wild–type receptor activation sensitivities to the antagonists are shown in orange.

