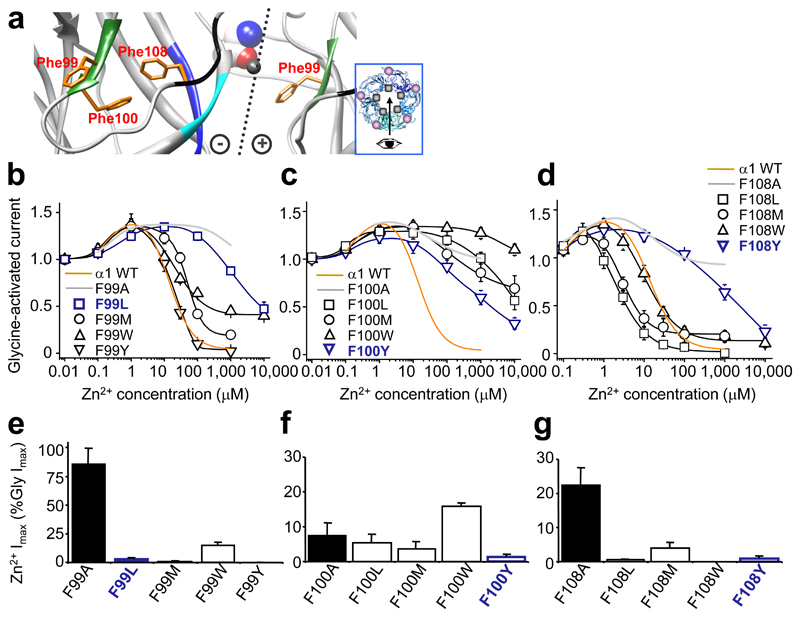
Figure 3. Zn2+ inhibition and Zn2+ activation in GlyRs with conservative substitutions.
(a) Homology model showing Phe99 and Phe100 from glycine binding loop A (green) and Phe108 from β5 strand of Zn2+ inhibition site (black). Dotted line: interface with (+) and (–) subunit sides 28. Glycine (CPK, spacefill) was docked manually 35; Zn2+ (representation only, grey spacefill). Inset – pentamer plan viewing angle (arrow), Zn2+ binding site (grey spot), glycine binding site (mauve spot). (b–d) Zn2+ concentration response curves for modulation of EC50 glycine currents from GlyRs with conservative hydrophobic substitutions at positions Phe99 (b), Phe100 (c), and Phe108 (d). For comparison, wild–type (WT) inhibition profiles (orange) and alanine substituted receptor profiles (grey) are included. The same set of substituted GlyRs were assessed for maximal Zn2+ (1 mM)–activated currents (Imax), normalised to glycine Imax (10 mM) in the same cell: Phe99 (e), Phe100 (f) and Phe108 (g). Alanine substituted receptor Zn2+ Imax (black bars) is shown for comparison. Note: F99L, F100Y and F108Y had substantially attenuated Zn2+ inhibition (navy blue lines) but almost no Zn2+ activation (navy blue bars; < 2% Gly Imax). (n = 3 – 6)

