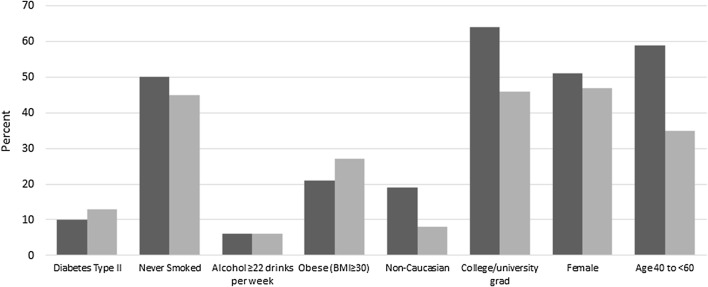
Fig. 1.
Representativeness of Ontario cancer risk factor (OCRF) study controls compared to the Canadian community health survey (CCHS) for Ontarians aged 40–90 in 2011. The dark bars represent the Canadian community health survey (CCHS) data, whereas, the light gray bars represent the Ontario cancer risk factor (OCRF) data

