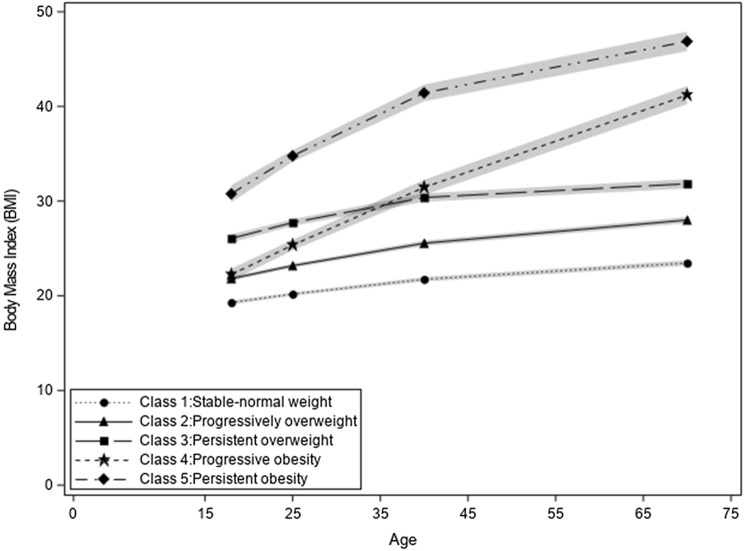
Fig. 2.
Latent BMI trajectories identified throughout the life-course (n = 1,568) among Cases Diagnosed in 2011–2013 and Controls Recruited in 2011, from Ontario, Canada. Class 1: Stable-normal weight trajectory is represented as the dotted line, with circular symbols. Class 2: Progressively overweigh trajectory is represented as the solid line, with triangular symbols. Class 3: Persistent overweight trajectory is represented as the line with long dashes, with square symbols. Class 4: Progressive obesity trajectory is represented as the line with small dashes, with star symbols. Class 5: Persistent obesity trajectory is represented as the line with dashes and dots, with diamond symbols

