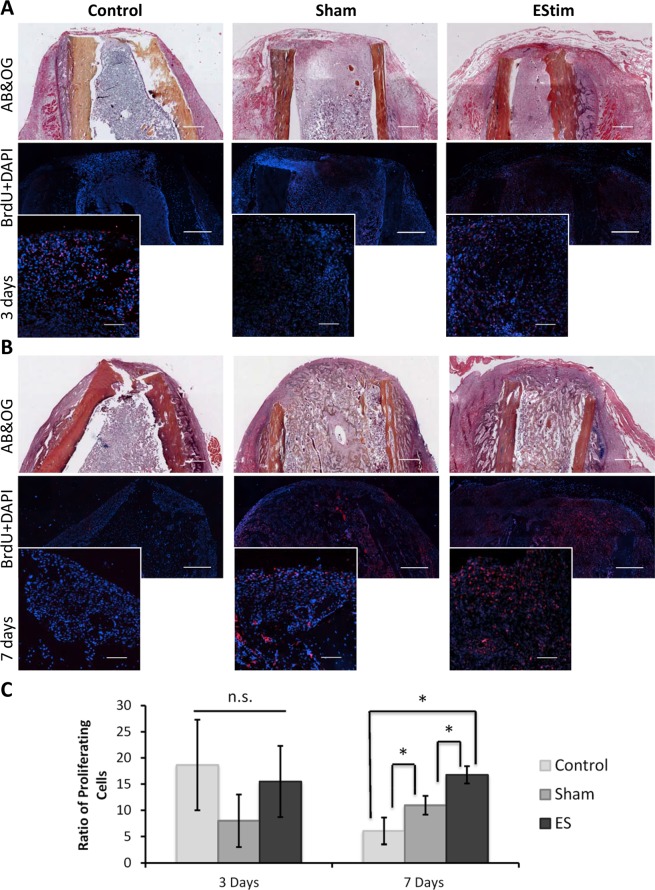
Figure 3.
BrdU analysis of cell proliferation in the distal end of the stump in control, sham and EStim treated samples. (A) Top and middle rows represent overview of day 3 post-amputation control, sham and EStim stump sections stained with AB&OG and anti-BrdU antibody (red) counterstained with DAPI (blue) respectively (4×; Scale bar = 500 µm). Bottom row shows high magnification images of BrdU stainings (20×; Scale bar = 50 µm). (B) Representative images of stump sections from control, sham and EStim groups 7 days post-amputation. Top and middle rows show an overview of samples stained with AB&OG and anti-BrdU antibody (red) and counterstained with DAPI (blue) respectively (4×; Scale bar = 500 µm). Bottom row displays high magnification images (20×; Scale bar = 100 µm); (C) Ratio of proliferative cells measured at the distal end of the stump at days 3 and 7 post-amputation. n.s. - non significant (p ≥ 0.05); *p < 0.05.

