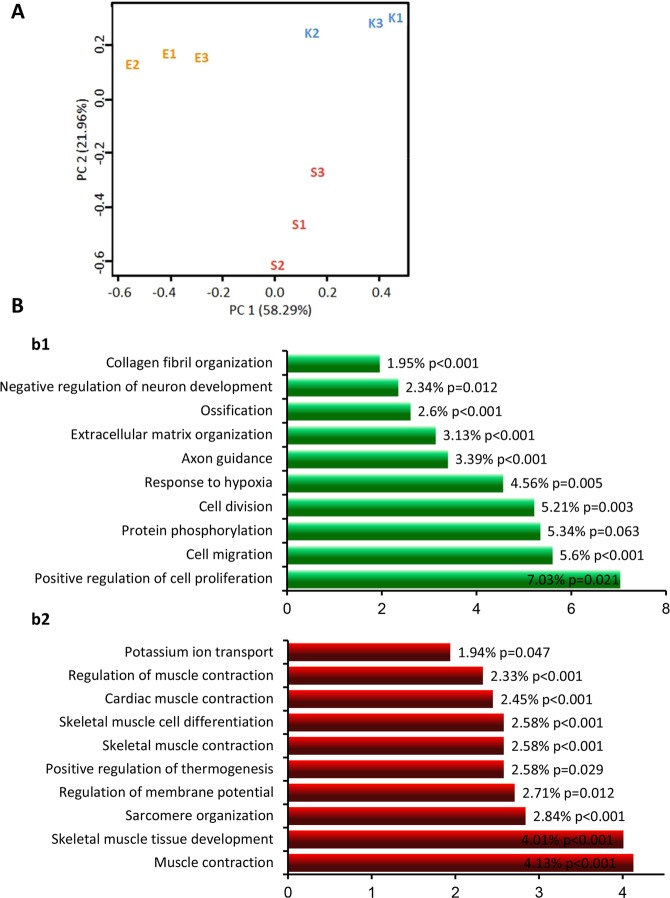
Figure 5.
mRNA expression profiles in EStim treated limb stumps and non-treated controls (control and sham) are distinct. (A) Principle component analysis of normalized read counts showed strong effect of EStim treatment. Biological replicates for EStim (E1, E2, E3), sham (S1, S2, S3) and control (K1, K2, K3) samples are shown. (B) Top-10 significantly enriched biological processes in EStim and sham transcriptomes (FunReach analysis). Each the EStim and sham transcriptomes were tested against Rattus Norvegicus UniProt database, the top 10 most highly represented biological processes and the percentage of proteins predicted to belong to each category are shown for EStim (b1) and sham (b2) samples. The numbers shown at the right side of each bar indicated the % of genes (proteins) involved in each term and p-Value.

