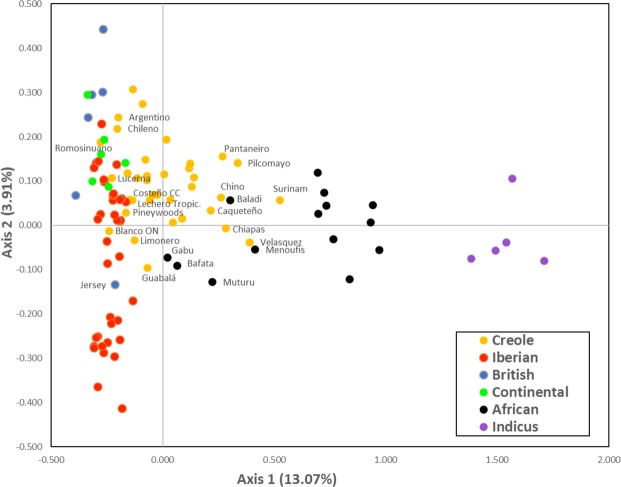
Figure 3.
Spatial representation of genetic distances among the breeds analyzed, from the first two axes obtained in the factorial analyses of correspondence based on microsatellite data. Values between brackets on both axes represent the contribution in % of each axis to total inertia. Colors represent the geographic origin as shown in the figure. The names of some breeds that correspond to areas of overlapping between groups are also shown.

