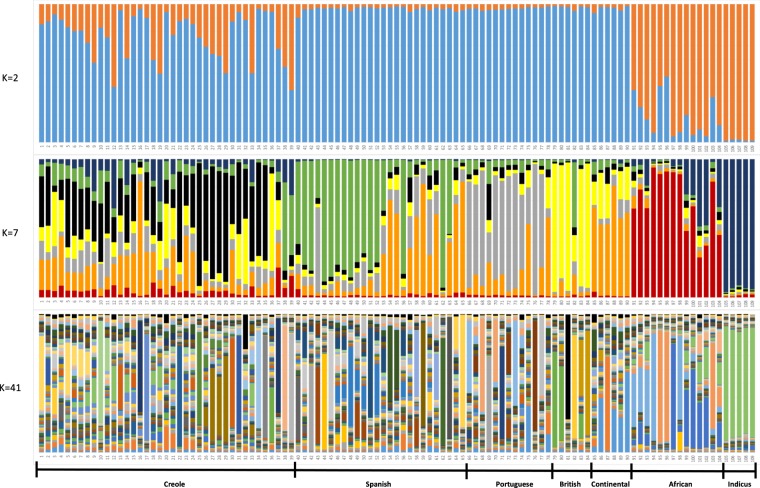
Figure 5.
Population structure of 109 cattle breeds inferred by using the STRUCTURE software and based on microsatellite data. Each breed is represented by a single vertical bar divided into K colors, where K is the number of assumed ancestral clusters, which is graphically represented for K = 2, 7 and 41. The colored segment shows the breed’s estimated membership proportions in a given cluster. Breed numerical codes are as defined in Table 1. Ancestral contributions for other values of K ranging from K = 2 to 40 are shown in Supplementary Fig. 2.

