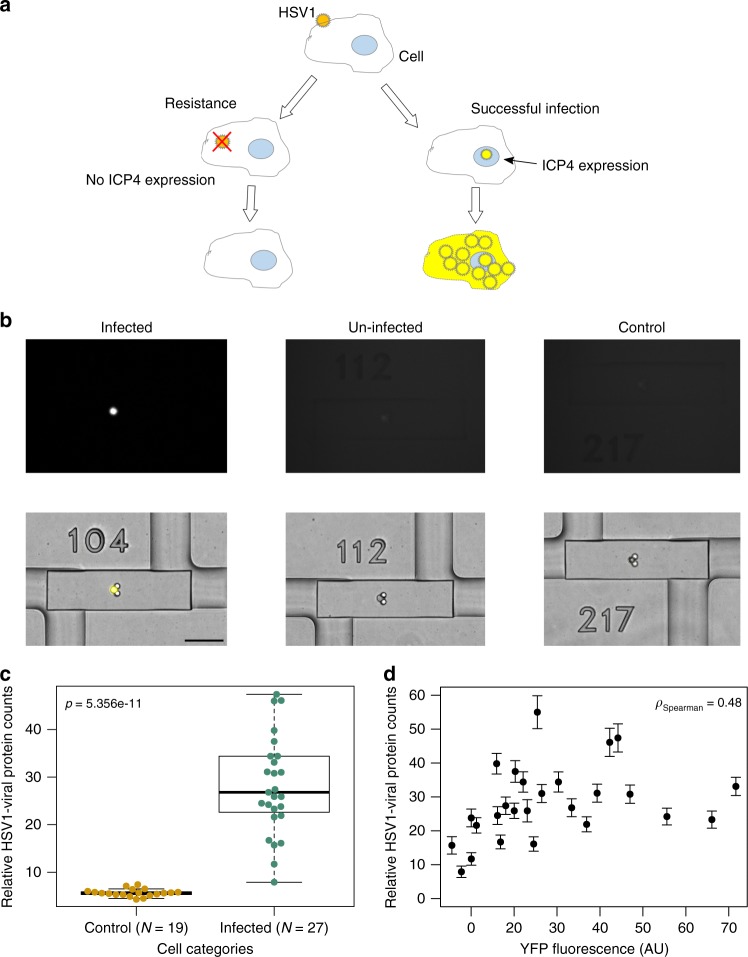
Fig. 4.
Joint live-cell imaging and digital protein analysis of HSV-1 virus infected human lung epithelial cells (A549) cells. a Schematic of viral infection process: if infection succeeded, viral genome goes into host cell nucleus and ICP4-YFP is expressed and viral proteins are produced; if the cell is resistant to viral infection, ICP4-YFP viral proteins will not be produced. b Images of ICP4-YFP (top), superimposed bright field (BF) and YFP (bottom) for infected, un-infected, and control single cells (scale bar: 100 µm). c Comparison of HSV-1 viral proteins counts in control cells (N = 19) and infected cells (N = 27) showed significant differences between two groups. P value was calculated using two-sided Welch’s t test. The center thick line of the box plot indicates the median of the data, the two hinges of the box represents the first and third quartile, and the whiskers indicate the full data range. d Correlation of the relative HSV-1 viral protein counts (microfluidic-digital proximity ligation assay (µ-dPLA) readout) with YFP fluorescence level has a Spearman’s coefficient of 0.48, which indicates that not all cells infected with HSV-1 went past the immediately-early protein synthesis stage. Error bars calculation is mentioned in the Methods section

