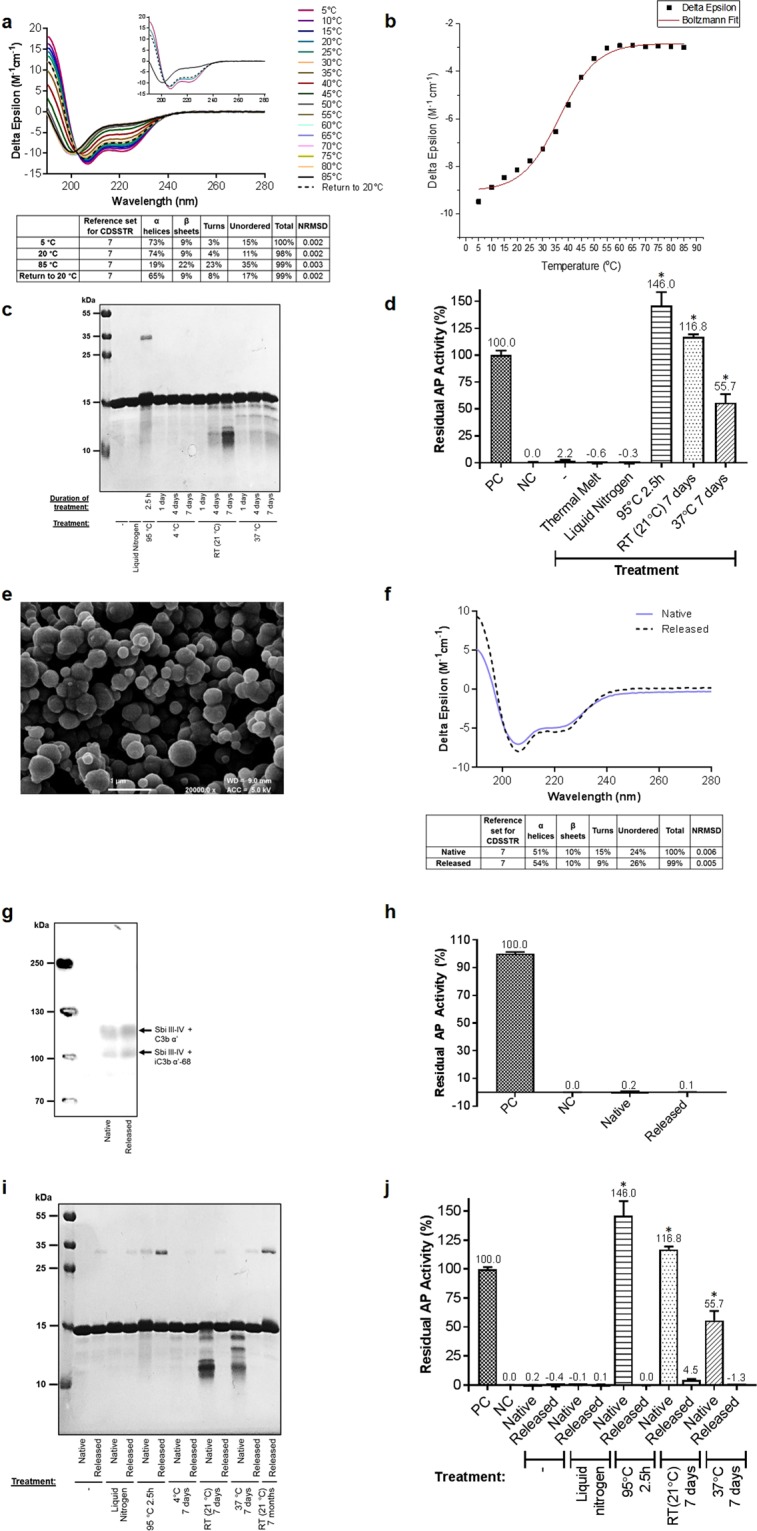
Figure 4.

Thermostabilisation of Sbi III-IV using ensilication. (a) Thermal melt circular dichroism spectroscopic study showing reversible thermal unfolding of Sbi III-IV. CD spectra at 5 °C, 20 °C, 85 °C and upon return to 20 °C are displayed in the inset figure. Deconvolution of CD data was performed using DichroWeb. (b) Boltzmann sigmoidal fit of CD thermal denaturation curve at 222 nm depicting a melting temperature of 35.6 °C. (c) Temperature-induced loss of Sbi III-IV structural integrity visualised by SDS-PAGE. (d) Thermal denaturation-mediated loss of Sbi III-IV (0.5 μM) complement depletion activity demonstrated by alternative pathway activity analysis. Data are displayed as mean values (n = ≥ 2) ± standard deviation from the mean. A one-way ANOVA with Dunnett’s multiple comparisons analysis was used to analyse differences in activity compared to native untreated Sbi III-IV., *P < 0.01. (e) FESEM image of ensilicated Sbi III-IV powder at 20,000x magnification. Scale bar is shown at the bottom of the image. See Supplementary Fig. S7 for FESEM images at 650x and 5,000x magnification. (f) CD spectra showing similar secondary structures for native and released Sbi III-IV. Spectra are representative of 10 replicates. Deconvolution of CD data was performed using DichroWeb. (g) Anti-Sbi western blot analysis illustrating comparable C3 activation by native and released Sbi III-IV (both at 27 μM). (h) Alternative pathway activity analysis demonstrating comparable C3 depletion activities for native and released Sbi III-IV (both at 0.5 μM). Data are displayed as mean values (n = ≥ 2) ± standard deviation from the mean. An unpaired t-test confirmed no significant difference in activity between native and released Sbi III-IV (P > 0.05). (i) SDS-PAGE illustrating thermal degradation of native but not released Sbi III-IV. A small amount of dimeric Sbi III-IV is present in all released samples. (j) Alternative pathway activity analysis showing temperature-induced loss of function in native but not in released Sbi III-IV (0.5 μM) samples. Data are displayed as mean values (n = ≥ 2) ± standard deviation from the mean. A one-way ANOVA with Dunnett’s multiple comparisons analysis was used to analyse differences in activity compared to native untreated Sbi III-IV. *P < 0.01. DLS, CD and opsonisation analysis of thermally-treated native and released Sbi III-IV can be found in Supplementary Figs S8–S10, respectively. Full-length gel images of (c,i) are included in Supplementary Figs S21 and S22. Full-length western blot image of (g) is shown in Supplementary Fig. S20.
