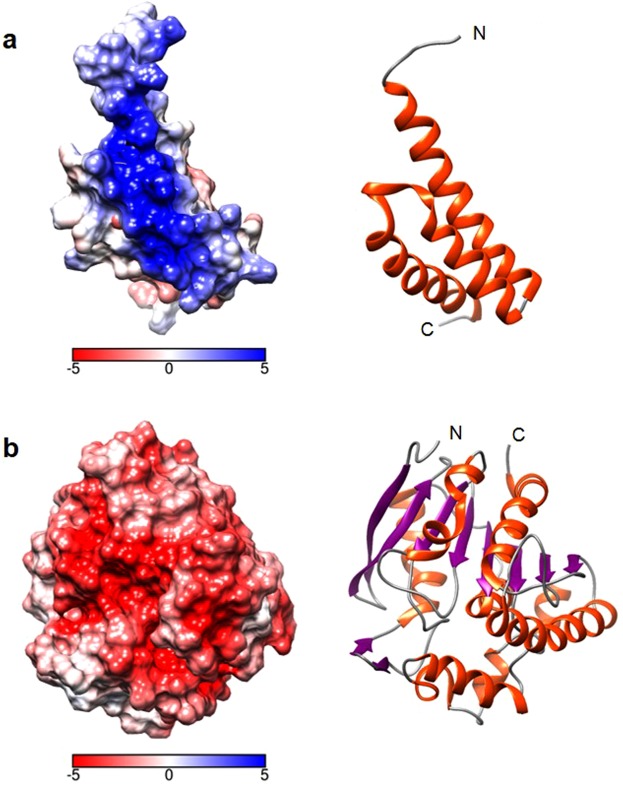
Figure 5.
Electrostatic potential surface charge distribution in Sbi IV (a) and Ag85b (b). The helix α2 surface of Sbi IV is largely positively charged (shown in blue) whereas Ag85b is primarily negatively charged (shown in red). Ribbon diagrams coloured by secondary structure in the same relative positions as the surface models are shown for comparison on the right. All images were generated in UCSF Chimera (version 1.13.1) using the PDB accession codes 2JVH (Sbi IV) and 1F0N (Ag85b).

